Oil Update
The February 21 Profit Radar Report said the following about crude oil:
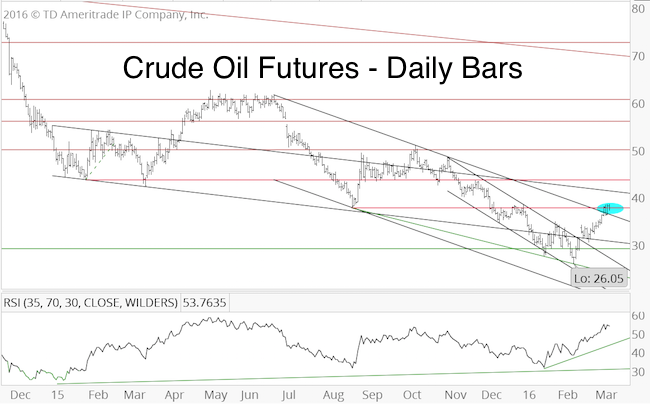
“Crude oil filled the massive gap left by Wednesday spike and is sitting right atop trend line support. Seasonality is strongly bullish until late April. For anyone interested in trading oil, this is a tempting setup to go long.
The problem with this trade is that oil has had massive daily swings, which makes identifying an effective stop-loss level nearly impossible. One of the goals of the Profit Radar Report is to keep risk at a minimum.
There is much up side to oil. Investors who don’t mind short-term drawdowns in exchange for potentially sizeable profits, this is a trade worth taking. However, since we cannot effectively limit risk, this won't be an official trade.”
If you enjoy quality, hand-crafted research, >> Sign up for the FREE iSPYETF Newsletter
The updated chart below shows that oil soared higher until it hit resistance near 38.
This resistance paused the rally and generated a bearish RSI divergence. More weakness is possibly, but ultimately higher prices are likely.
Gold Update
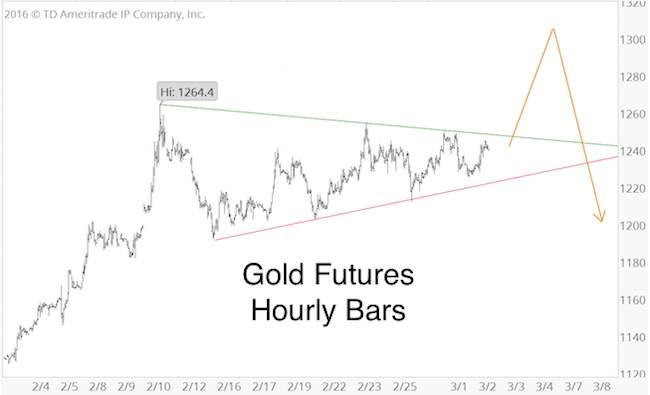
The March 2, Profit Radar Report pointed out a potential triangle formation for gold, and stated:
“Gold appears to be carving out a triangle. Upon completion, triangles often lead to strong, but temporary breakouts. A quick spike to 1,300 +/- could mark the end of the initial up leg from the December low. Such a quickly reversed spike higher followed by a multi-week/months correction (see yellow projection) would harmonize to a satisfactory degree with seasonality and sentiment. A break above 1,255 would be the first steps towards a post-triangle spike.”
The chart below was published via the same update.
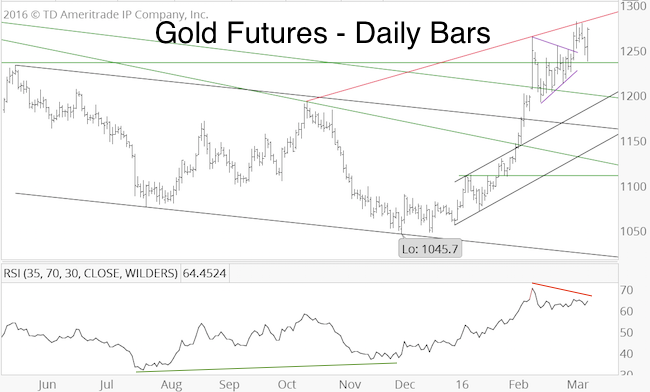
The second chart provides more long-term context. The purple lines outline the triangle formation. The initial post triangle thrust stopped at trend line resistance (ascending red line), and created a bearish RSI divergence. Gold found support today, and rallied higher. This keeps the potential of a move to 1,300+/- alive, but chasing this move would take impeccable timing.
Continuous updates for oil, gold, silver, S&P 500 and other assets classes are available via the Profit Radar Report.
Simon Maierhofer is the publisher of the Profit Radar Report. The Profit Radar Report presents complex market analysis (S&P 500, Dow Jones, gold, silver, euro and bonds) in an easy format. Technical analysis, sentiment indicators, seasonal patterns and common sense are all wrapped up into two or more easy-to-read weekly updates. All Profit Radar Report recommendations resulted in a 59.51% net gain in 2013, 17.59% in 2014, and 24.52% in 2015.
Follow Simon on Twitter @ iSPYETF or sign up for the FREE iSPYETF Newsletter to get actionable ETF trade ideas delivered for free.
If you enjoy quality, hand-crafted research, >> Sign up for the FREE iSPYETF Newsletter
|
