The excerpt below is taken from the March 3, 2024 Profit Radar Report:
Momentum markets:
Since the October low, the S&P 500 has now closed higher 16 of the last 18 weeks and rallied 24.76%. Although our analysis has consistently, and even through the darkest of times, maintained that stocks will rally, come back, and likely even reach new all-time highs, the scope of the post-October rally is way beyond what I expected.
Rally momentum has reached historic proportions. I’ve experience (with many of you loyal subscribers) other momentum markets before and have been reading through old PRRs to find comments on similar momentum markets.
August 2017 - January 2018
The S&P closed higher 18 of 23 weeks and gained 18.44%. Similar to a few weeks ago, this rally was accompanied by bad breadth.
The November 19, 2017, PRR analyzed multiple market forces (momentum, breadth, EWT) and summarized the 1-3 month outlook as follows: “It's challenging to find a common denominator between the bullish momentum and bearish breadth implications. We have noticed that many of the rallies since the February 2016 low lacked strong breath readings. Therefore it seems more likely that momentum (supported by seasonality) will trump breadth and push prices higher in coming weeks.”
January 15, 2018, PRR: “Elliott Wave Theory and investor sentiment caution that a pullback (wave 4, 5-10%) is nearing, but we've said that before, and it will take some visible weakness (without quickly creating an oversold condition) to create ‘down side escape velocity.”
September 2019 - February 2020
The S&P 500 closed higher 15 of 19 weeks and gained 17.26%. Similar to a few weeks go, this rally triggered Hindenburg signals. Below are PRR comments made regarding momentum during that period.
November 24, 2019 PRR: “As the extended period above the 10-day SMA suggests, we are in a momentum market, and momentum markets tend to move higher than expected. However, Thursday delivered additional ‘bi-polar’ readings (a large number of new 52-week highs and lows for Nasdaq and NYSE). Those bi-polar readings contribute to Hindenburg signals, which tend to be a rather consistent negative for stocks (over the next 0-3 month).”
December 15, 2019 PRR: “Current environment seems to be similar to late 2017. Momentum can drive prices higher than reasonable … but at some point stocks will take a hit, and such a hit could reduce values by 10 - 30%. It would, however, not mark the end of this bull market.”
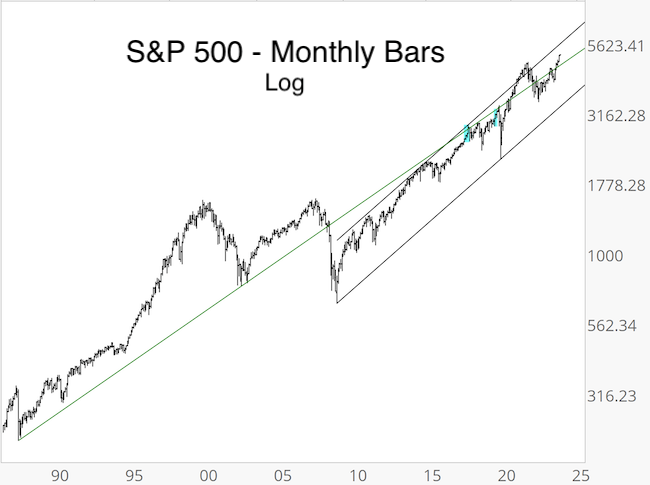
The long-term S&P 500 log scale chart below shows the green long-term trend line (going back to the 1987 low) and highlights the 2017/18 and 2019/20 momentum markets in blue.
Here are the key takeaways from prior momentum markets:
-
They tend to last longer than expected
-
They tend to correct swiftly and strongly
-
They tend to not mark major market tops
Continued updates and factual out-of-the box analysis are available via the Profit Radar Report.
The Profit Radar Report comes with a 30-day money back guarantee, but fair warning: 90% of users stay on beyond 30 days.
Barron's rates iSPYETF a "trader with a good track record," and Investor's Business Daily writes "Simon says and the market is playing along."
|
