On December 24, 2018, the S&P 500 closed at 2,351.10. Much of the financial media pronounced a bear market that very day:
-
CNBC: We are Now in a Bear Market - December 24, 2018
-
Yahoo! Finance: S&P 500 Enters Bear Market: December 24, 2018
-
Investors Business Daily: S&P 500 Enters Bear Market - December 24, 2018
-
Motley Fool: Here’s Why the S&P 500 Plunged into a Bear Market - December 27, 2018
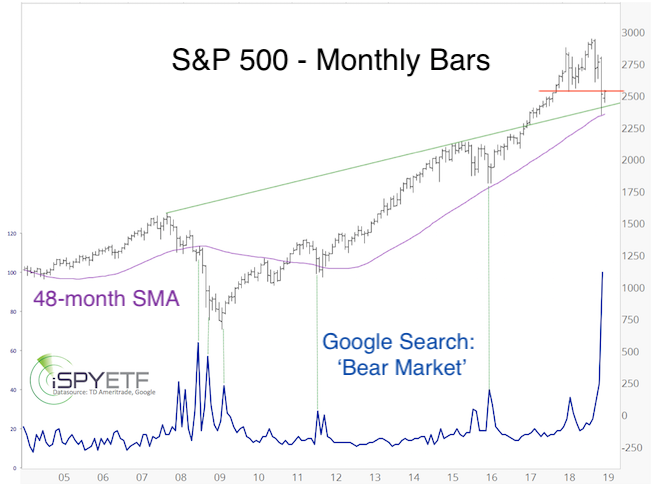
As the chart below shows, Google searches for 'bear market' also soared to an all-time high.
The entire bear market discussion is superfluous in my humble opinion. I explained why in the December 19 Profit Radar Report:
“‘Bull market’ and ‘bear market’ is a status like ‘online’ or ‘offline.’ Just because someone is offline today, doesn’t mean they can’t be online tomorrow. As any momentary snapshot status, the bull/bear market status is not predictive of future events.
In fact, statistically, most bear markets end after the S&P 500 declines 16%. The red graph below shows the average path of the past 10 bear markets (as defined by Ned Davis Research). The S&P has almost reached the maximum down side of the average bear market.”
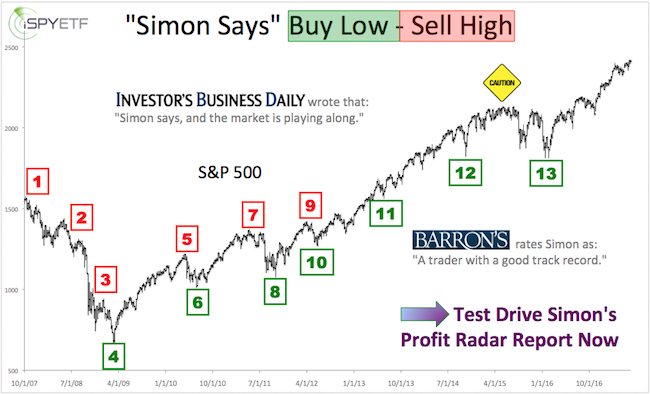
Barron's rates iSPYETF as "trader with a good track record" and Investor's Business Daily says: "When Simon says, the market listens." Find out why Barron's and IBD endorse Simon Maierhofer's Profit Radar Report.
Below is an updated version of the chart published in the December 19, PRR.
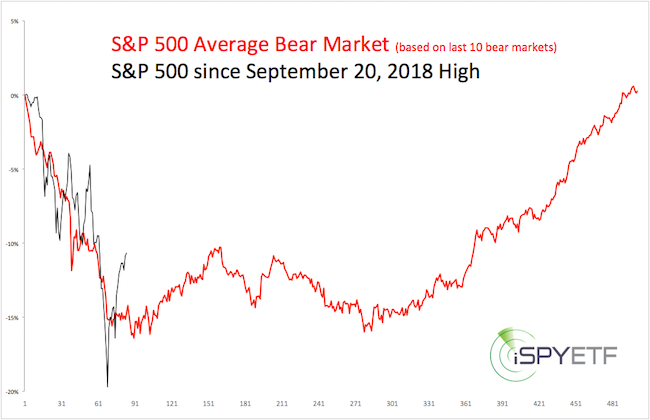
Even though the S&P overshot to the down side, and now to the up side, it is following the average bear market trajectory … if one considers this a bear market.
If you enjoy quality, hand-crafted research, >> Sign up for the FREE iSPYETF e-Newsletter
Also note how the S&P bounced from support shown in the first chart.
Is this Bear Market Already Over?
Breadth thrust says: Yes.
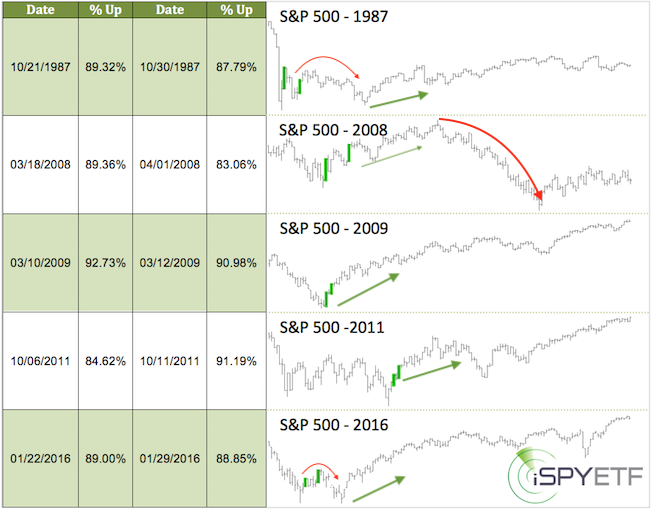
On December 26, and January 4, 87% and 90% of NYSE-traded stocks advanced. Since 1985, there have been 5 other times when >85% of NYSE-traded stocks advanced within a 2-week period. Those 5 times are listed below. To the right of each date is a thumbnail chart, which shows how the S&P 500 performed over the next 6 month.
-
In 1987, and 2016 the S&P retested the initial panic low.
-
In 2009 and 2011, the S&P took off to the up side.
-
The 2008 thrust was followed by a rally, but ultimately failed.
Divergences say: No.
Divergences, bullish or bearish, are a helpful forecasting tool. Why?
Prior to a major market turn, market internals tend to divergence from price. If there is no divergence, the odds of a major turn are lower.
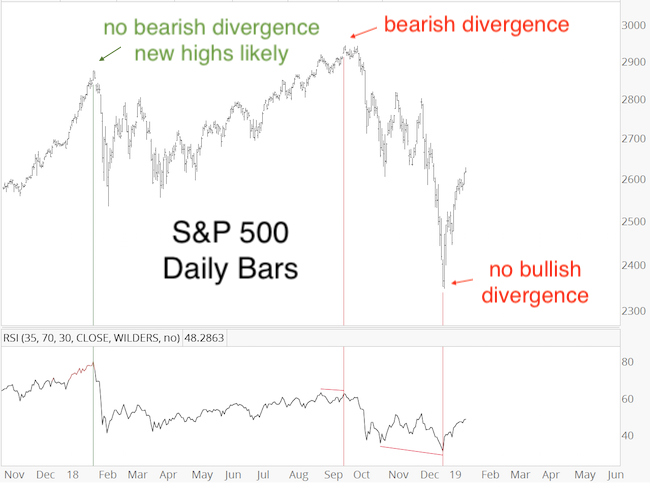
For example: At the January 2018 top, the S&P 500 and RSI-35 peaked on the same day. The January 31, 2018 Profit Radar Report stated that: “There was no RSI-35 divergence at Friday’s high. This very likely means that Friday’s high will eventually be exceeded.”
That's what happened. But, there was a bearish divergence at the September 2018 high, which means new highs are no longer guaranteed.
More importantly, there was no bullish divergence at the December low. This doesn’t mean stocks can’t reach new highs, but due to the bearish divergence at the September 2018 top and the lack of bullish divergence at the December 2018 bottom, the odds of new all-time highs are reduced.
Conflict
Unfortunately there is a conflict between two pretty reliable indicators/studies. The breadth thrust suggests new highs, while divergences (or lack thereof) suggest new lows.
Tie-breaker
The S&P reached the black trend channel, which has been my up side target. The channel has acted as support/resistance numerous times over the past year, and may do so again. A re-test of previously broken support has ‘last kiss good bye' potential.
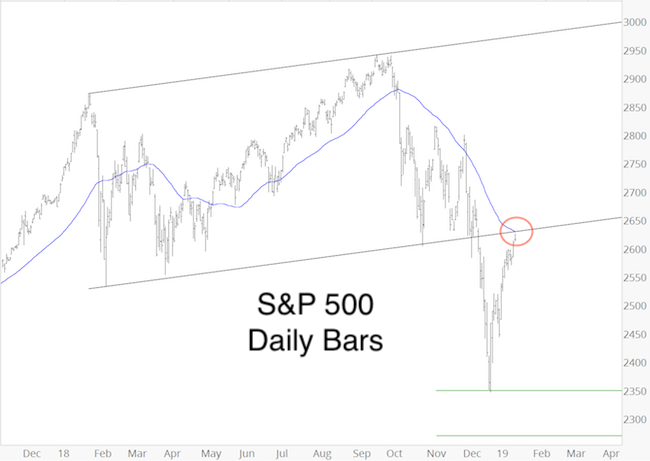
Unfortunately that matter is complicated by the fact that the popular 50-day SMA (blue line) coincides with the hand-crafted trend channel. The market likes to see-saw popular SMAs to fool the masses.
The 2-hour chart provides some more details: Yesterday, the S&P 500 broke above the gray trend channel (blue circle). While above that trend channel, trade may continue higher (note the potenial triangle outlined by the purple lines, or diagonal outlined by the blue lines).
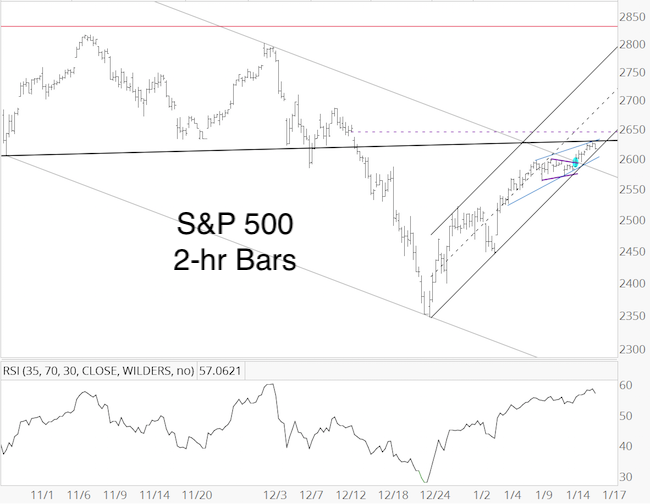
However, the larger black trend channel near 2,625 may end this rally leg (perhaps with some see-saw, courtesy of the 50-day SMA). A break back below the gray trend channel should usher in a 100+ point correction, possibly even a re-test or break of the December low.
Continued updates are available via the Profit Radar Report.
Simon Maierhofer is the founder of iSPYETF and the publisher of the Profit Radar Report. Barron's rated iSPYETF as a "trader with a good track record" (click here for Barron's evaluation of the Profit Radar Report). The Profit Radar Report presents complex market analysis (S&P 500, Dow Jones, gold, silver, euro and bonds) in an easy format. Technical analysis, sentiment indicators, seasonal patterns and common sense are all wrapped up into two or more easy-to-read weekly updates. All Profit Radar Report recommendations resulted in a 59.51% net gain in 2013, 17.59% in 2014, 24.52% in 2015, 52.26% in 2016, and 23.39% in 2017.
Follow Simon on Twitter @ iSPYETF or sign up for the FREE iSPYETF e-Newsletter to get actionable ETF trade ideas delivered for free.
|
