Bloomberg just called the inverted yield curve the ‘harbinger of doom.” Is this a fact or fear mongering?
What is an inverted yield curve?
In the investment world, there is generally a strong correlation between maturity and yield. Longer-term maturities pay more interest than shorter-term maturities.
For example, 10-year Treasuries pay more interest than 2-year Treasuries. Since this happens most of the time, this condition is called a normal yield curve (blue graph).
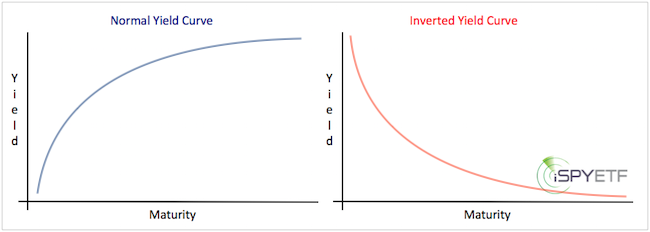
But, we live in interesting times, and the yield curve is about to invert (red graph). This means longer-term maturities actually pay less than shorter-term maturities.
Harbinger of doom?
In fact, the short end of the yield curve - 5-year compared to 3-year (5/3) - has already inverted, which means that 3-year maturities actually pay more interest than 5-year maturities.
This has happened five other times since 1970 (red arrows on chart below mark occurrences since 1976). Only in 1973 did it coincide with a market top. The other four times, it took a minimum of two years before the next big correction.
The chart below plots the S&P 500 against a more popular yield curve, which compares the 10-and 2-year yields. The spread is currently only 0.11%, and it’s threatening to fall below zero for the first time since 2007.
If you enjoy quality, hand-crafted research, >> Sign up for the FREE iSPYETF e-Newsletter
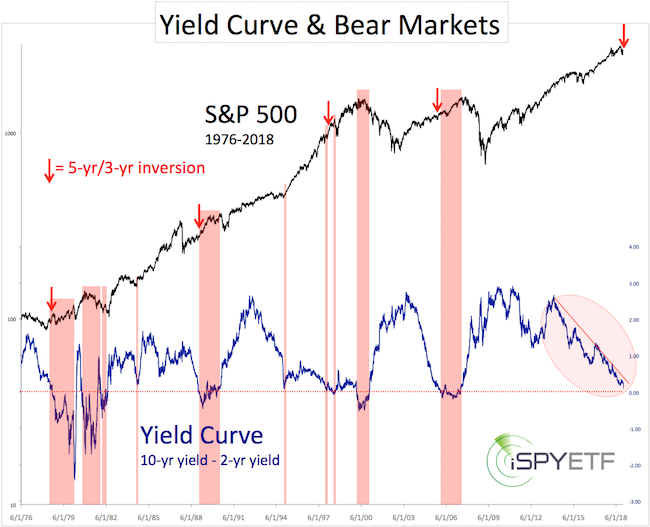
The red bars mark all prior times when the 10/2 yield curve inverted. Although it led to bear markets in 2000 and 2005, it was not a consistent ‘harbinger of doom’ in the 20th century.
It’s also worth mentioned that the S&P 500 was down more than 11% before the yield curve inverted.
Conclusion
The facts show that using an inverted yield curve - 10/2 or 5/3 doesn’t matter - as a bear market signal is at best inaccurate, and at worst misleading.
However, and that’s a big however, that doesn’t mean that stocks won’t slip into a bear market. There are other reasons why stocks were ‘supposed to’ tumble.
My down side targets, published on September 3 (when the S&P traded around 2,900) via the Profit Radar Report, ranged from 2,575 - 2,289. That down side target was provided before the yield curve inverted.
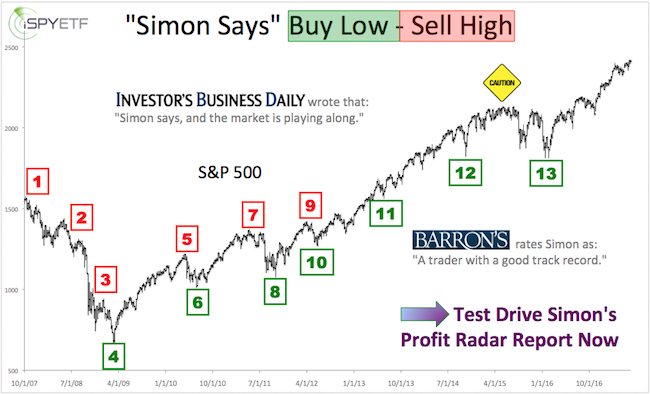
Barron's rates iSPYETF as "trader with a good track record" and Investor's Business Daily says: "When Simon says, the market listens." Find out why Barron's and IBD endorse Simon Maierhofer's Profit Radar Report.
Continued updates are provided via the Profit Radar Report.
Simon Maierhofer is the founder of iSPYETF and the publisher of the Profit Radar Report. Barron's rated iSPYETF as a "trader with a good track record" (click here for Barron's evaluation of the Profit Radar Report). The Profit Radar Report presents complex market analysis (S&P 500, Dow Jones, gold, silver, euro and bonds) in an easy format. Technical analysis, sentiment indicators, seasonal patterns and common sense are all wrapped up into two or more easy-to-read weekly updates. All Profit Radar Report recommendations resulted in a 59.51% net gain in 2013, 17.59% in 2014, 24.52% in 2015, 52.26% in 2016, and 23.39% in 2017.
Follow Simon on Twitter @ iSPYETF or sign up for the FREE iSPYETF e-Newsletter to get actionable ETF trade ideas delivered for free.
|
