It’s time for an update on the most powerful stock market indicator in recent history – the major market top indicator.
This indicator (dubbed ‘secret sauce’) correctly foreshadowed the 1987, 2000 and 2007 market tops. The same indicator also ‘told us’ that the bull market will continue after the corrections of 2010, 2011, 2012 and thereafter.
A detailed explanation of this indicator (and why we call it ‘secret sauce’) is available for review here.
The October 8 column “The Missing Ingredient for A Major Market Top” mentioned a fledgling bearish non-confirmation (the first one since 2007).
Non-confirmations between the S&P 500 and ‘secret sauce’ are the first indication of a major market top. Here is how the October 5 Profit Radar Report assessed this fledgling divergence:
“There is a small bearish divergence between the S&P 500 and the [indicator name replaced with ‘secret sauce’].
It is conceivable that this small divergence could mark a major top, but it is unlikely. Prior tops were preceded by multi-month divergences. Based on strong Q4/Q1 seasonality and the ‘need’ for a multi-month divergence, we expect new bull market highs later in 2014 or 2015.”
As proposed, strong seasonality and the ‘need for a multi-month divergence’ erased the fledgling divergence, and the S&P 500 moved to new all-time highs in 2015.
The May 17 Profit Radar Report noted a renewed bearish non-confirmation.
The May 31 Profit Radar Report observed the following:
“At the latest all-time closing high for the S&P 500 (May 21), 27% of S&P 500 stocks traded within 2% of a 52-week high, while 13% of S&P 500 stocks already lost 20% or more since their latest high.
28% of S&P MidCap 400 stocks were within 2% of a 52-week high. 17% already lost more than 20%
16.8% of S&P SmallCap 600 stocks were within 2% of a 52-week high. 23% already lost 20% or more.
This internal deterioration and indication of buying selectivity is confirmed by [indicator name replaced with ‘secret sauce’] and the percentage of NYSE stocks above their 50-day SMA.
Negative divergences like this tend to draw stocks lower. This doesn’t have to happen immediately, but this particular divergence has lasted longer than any other in the last years, and is likely to turn into a drag eventually.”
If you enjoy quality, hand-crafted research, >> Sign up for the FREE iSPYETF Newsletter
Eventually turned out to be August 19 – 24, when the S&P 500 lost 229 points in four days.
Is the Bull Market Over?
The updated chart below highlights the bearish non-confirmation noted in various Profit Radar Reports.
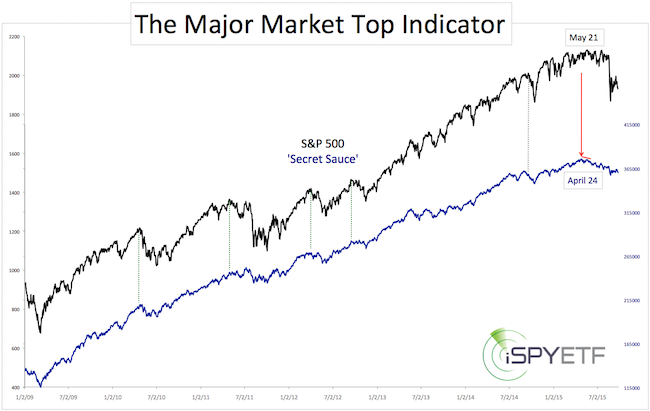
The 2015 divergence is more pronounced than the October 2014 divergence, but not as obvious as divergences seen prior to past major tops (4 – 24 months).
Based on the ‘secret sauce’ major market top indicator, the May 21 S&P 500 closing high could mark the last day of the post-2009 bull market. However, the bearish divergence is shorter than all recent historic precedents, so bulls and bears should be careful.
Old Bull or New Bear Market – It Doesn’t Matter (for now)
Just because the market hasn’t given a conclusive answer to the bull/bear market debate (yet) doesn’t mean we are in the dark.
Quite to the contrary, the S&P 500 has been following the path we identified months ago (we call it ‘our script’). What is ‘the script’?
The script is a comprehensive forecast (based on literally dozens of indicators and historical statistics) illustrated with one simple chart (read about it here and here).
The script pointed towards new lows (or at least a test of the August low at S&P 1,867). In fact, the September 20 Profit Radar report listed five reasons why stocks should head lower:
-
“History: Panic declines, like in August, tend to be followed by a period of testing and another low, or at least a test of the low. Historical evidence: Since 1928, the S&P 500 dropped 10% or more from a 52-week high to a 3-month low, followed by a 3% bounce over 3 days (as was the case as of August 28) 21 times. 10 out of 21 times the S&P 500 tested or violated the low before going higher. 5 times the S&P staged a V-shaped recovery, and six times it eventually moved into a new bear market (3 of those 6 times the S&P rallied first before heading lower).
-
Seasonality: Late September/early October is one of the worst times for the S&P 500 in terms of seasonality (click here for S&P 500 seasonality chart).
-
The S&P 500 ended August with a loss of more than 5%. Since 1928, that’s happened 13 times (not including August 2015). The September after a 5% loss August was positive only 4 out of 13 times.
-
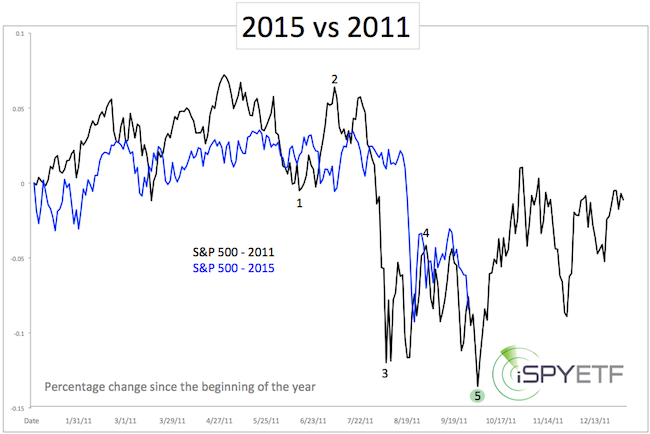
The 2011 script foretold a July/August sell off followed by weeks of sideways trading and another low.
-
Elliott Wave Theory combined with analysis of ‘rogue waves’.”
If you enjoy quality, hand-crafted research, >> Sign up for the FREE iSPYETF Newsletter
In short, our dashboard of indicators suggested that 2015 will follow the script of 2011.
A picture says more than a thousand words. For continued updates and out-of-the-box analysis, sign up for the Profit Radar Report.
Simon Maierhofer is the publisher of the Profit Radar Report. The Profit Radar Report presents complex market analysis (S&P 500, Dow Jones, gold, silver, euro and bonds) in an easy format. Technical analysis, sentiment indicators, seasonal patterns and common sense are all wrapped up into two or more easy-to-read weekly updates. All Profit Radar Report recommendations resulted in a 59.51% net gain in 2013 and 17.59% in 2014.
Follow Simon on Twitter @ iSPYETF or sign up for the FREE iSPYETF Newsletter to get actionable ETF trade ideas delivered for free.

If you enjoy quality, hand-crafted research, >> Sign up for the FREE iSPYETF Newsletter
|
