Although I warned of an environment where the risk of a meltdown is high (wave 3 down, based on Elliott Wave Theory), I can’t claim credit for predicting the December crash.
Because of my multi-indicator approach to market forecasting, and profound concern for my subscribers' portfolio’s, I rarely ever make absolute one-directional predictions based on only one indicator.
Absolute Predictions
There are plenty of absolute and unequivocal predictions out there. Such ‘hit or miss’ or ‘all or nothing’ bets are great when they work out (and like gambling, sometimes they do), but cause excruciating pain when they don’t.
Below are a few examples of recent all or nothing predictions:
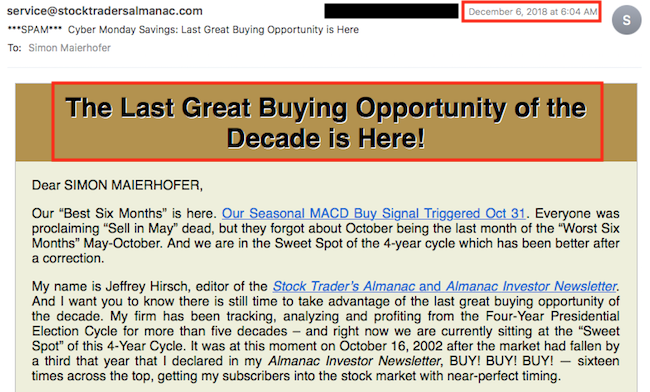
December 6: “The last great buying opportunity of the decade is here!”
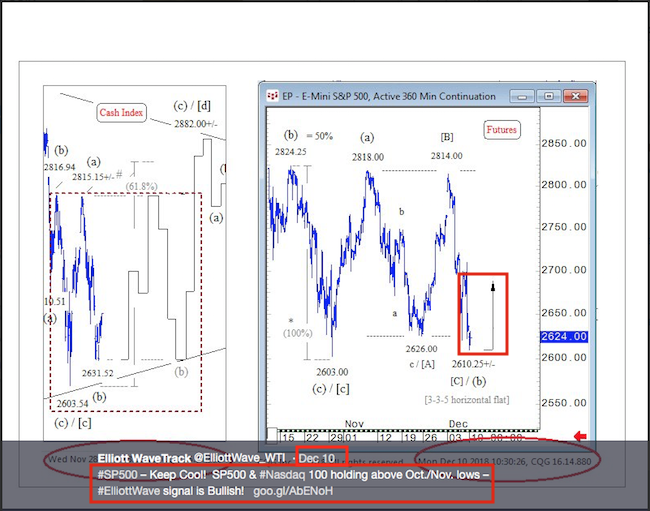
December 10: “Keep cool! S&P 500 & Nasdaq holding above lows. Signal is bullish!”
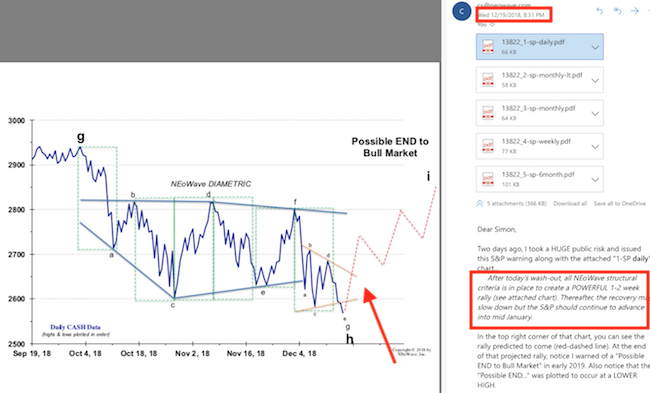
December 19: “ All structural criteria is in place to create a POWERFUL 1-2 week rally”
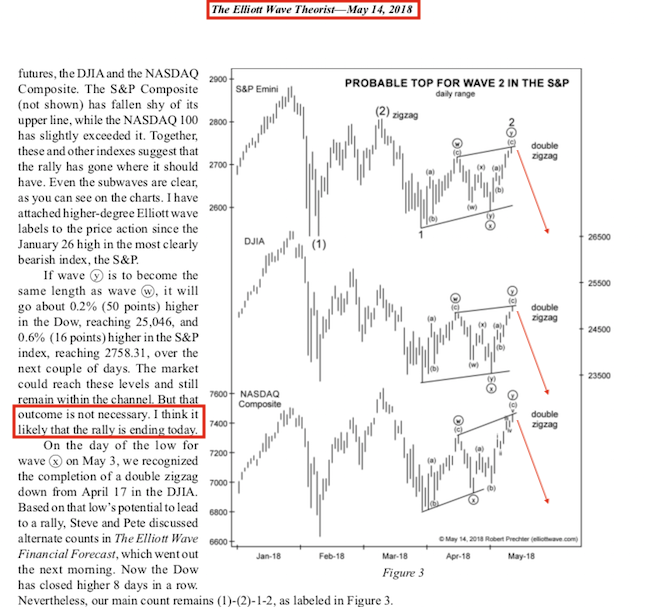
My favorite: May 14, 2018 (and virtually every day since 2011): “I think it likely that the rally is ending today” (red arrows added to show implications of wave 2 top, and subsequent wave 3 decline)
I found in my research that the only folks who ‘predicted’ the December meltdown, are those we’ve been spewing doom and gloom for years (even a broken clock is right twice a day).
My Promise
My intent is not to discredit the above services, but to highlight the flaws of tunnel vision research. That is, research based on only one indicator or one methodology.
Before publishing the Profit Radar Report (many, many years ago), I lost a lot of money by trusting one single indicator (which at the time had a good track record). Back then, I took off my ‘research blinders,' and vowed to expand my research horizon.
If you enjoy quality, hand-crafted research, >> Sign up for the FREE iSPYETF e-Newsletter
Better Diversification
Diversification is a popular term in the investment world, and it’s almost exclusively linked to asset allocation. But what about research diversification?
Just as a diversified portfolio smoothes out individual boom and bust cycles, research diversifcation eliminates the ‘hit or miss’ performance tied to any one single indicator.
Multi-indicator Approach
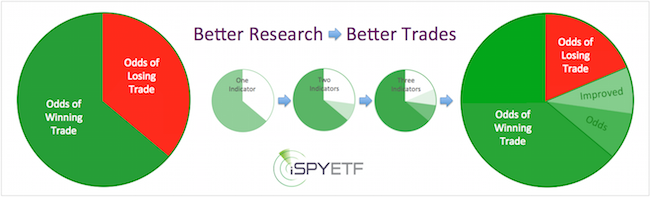
My goal is to distill and compress the message of various indicators (such as: investor sentiment, money flow, breadth, technical analysis, price patterns, seasonality, etc.) into the most likely path going forward, the direction suggested by the weight of evidence.
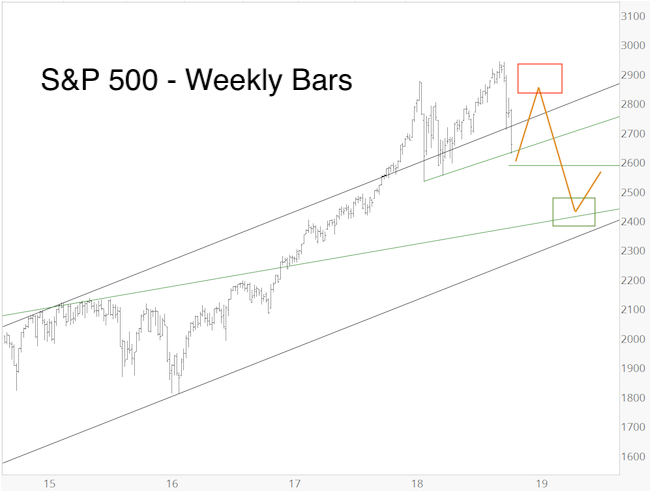
For example, on October 28, when the S&P 500 first fell into the 2,600s, I published the weight-of-evidence-based projection (yellow lines) along with the below commentary via the Profit Radar Report:
“The biggest potential ‘fat pitch’ trades are to go short above 2,830 (red box) or buy at the second low (green box).”
The yellow lines projected a move from 2,600 to ~2,850, followed by a drop to ~2,400.
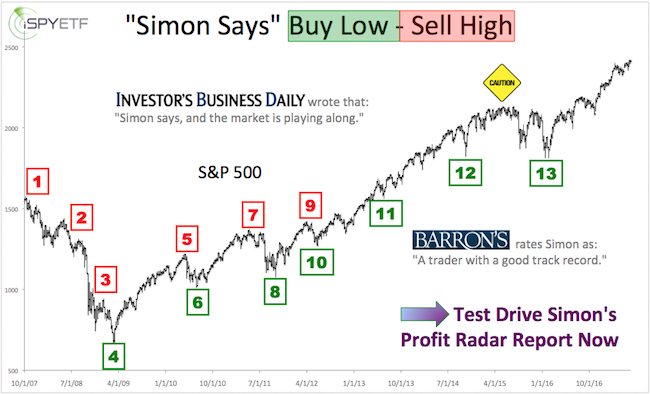
Barron's rates iSPYETF as "trader with a good track record" and Investor's Business Daily says: "When Simon says, the market listens." Find out why Barron's and IBD endorse Simon Maierhofer's Profit Radar Report.
Crash Environment Alert
Starting on December 9, I warned subscribers that a wave 3 crash is a possibility. For example, the December 9 Profit Radar Report stated that:
“Based on Elliott Wave Theory, the S&P 500 could be 1) nearing the exhaustion point of this down leg, or 2) be in a strong and sustained wave 3 lower. Scenario #2 seems more likely.”
The December 17 Profit Radar Report reiterated the following:
“Based on Elliott Wave Theory, both options discussed on December 9:
1) Washout decline with target of 2,550 - 2,500 (or 2,478 as per Sunday’s PRR)
2) Accelerating wave 3 lower (which could erase another 10% fairly quickly)
are still alive.”
In case you are new to Ellliott Wave Theory (one of the many indicators of the multi-indicator approach), here is a description of a wave 3:
Wave 3 is the longest and most powerful of all Elliott Waves. Wave 3 continues to move higher (or lower) despite overbought (or oversold) momentum and sentiment readings. A common target for wave 3 is a Fibonacci 1.618 of wave 1 (which currently is 2,269 for the S&P 500).
Pros and Cons
One ‘drawback’ of the multi-indicator approach is that you will rarely hear a flashy ‘all or nothing’ call.
The benefit is that you will rarely be on the losing end of such a call. The multi-indicator approach does however, outline when the risk of a crash or the potential of a spike is elevated.
And perhaps most importantly, there are times when nearly all indicators point in the same direction to form a potent and very reliable buy/sell signal (such as in March 2009, October 2011, February 2016).
Based on what I’m seeing right now, it seems like we are nearing such a signal.
The latest S&P 500 forecast is available here: Short-term S&P 500 Update
Simon Maierhofer is the founder of iSPYETF and the publisher of the Profit Radar Report. Barron's rated iSPYETF as a "trader with a good track record" (click here for Barron's evaluation of the Profit Radar Report). The Profit Radar Report presents complex market analysis (S&P 500, Dow Jones, gold, silver, euro and bonds) in an easy format. Technical analysis, sentiment indicators, seasonal patterns and common sense are all wrapped up into two or more easy-to-read weekly updates. All Profit Radar Report recommendations resulted in a 59.51% net gain in 2013, 17.59% in 2014, 24.52% in 2015, 52.26% in 2016, and 23.39% in 2017.
Follow Simon on Twitter @ iSPYETF or sign up for the FREE iSPYETF e-Newsletter to get actionable ETF trade ideas delivered for free.
|
