This bull market has been counted out many times. Just over the past few years, stocks faced three – allegedly – unavoidable bear markets … and escaped all of them.
Here are the three ‘unavoidable’ bear markets, and why stocks escaped:
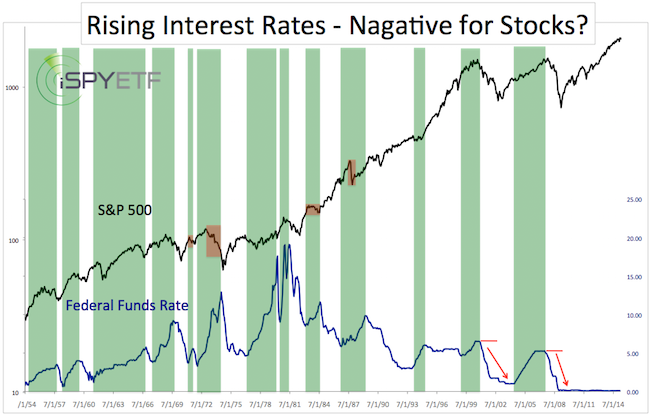
Unavoidable Rate Hike Bear Market
Starting in 2015, the Federal Reserve let it be known that interest rates will be rising.
According to the pros, rising rates would sink stocks. After all, that’s why the Fed kept them near zero for so long.
However, history simply doesn’t agree with this conclusion. The April 26, 2015 Profit Radar Report used the chart below to illustrated that rising rates are not bearish.
In fact, 9 of the 13 periods of falling rates (since 1954) saw stocks rally. That’s why the Profit Radar Report concluded that: “A rate hike disclosed at the April, June, July or even September or October FOMC meetings is unlikely to coincide with a major S&P 500 top.”
Barron's rates iSPYETF as a "trader with a good track record." Click here for Barron's assessment of the Profit Radar Report.
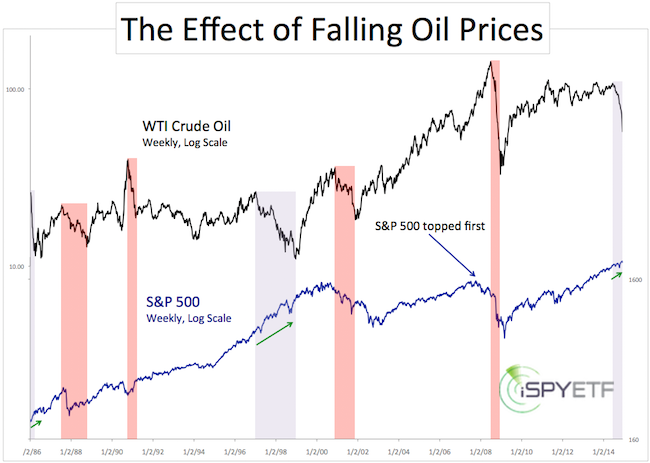
Unavoidable Oil Slump Bear Market
Falling oil prices were the hot topic as prices dropped 50% from June – December 2014.
The general opinion was that falling oil prices would send stocks lower, like in 2008.
If you enjoy quality, hand-crafted research, >> Sign up for the FREE iSPYETF Newsletter
The December 14, 2014 Profit Radar Report ousted this bogus reasoning with the chart and commentary below:
“This year's oil price collapse differs from the 2008 collapse relative to the S&P 500. In 2008, the S&P 500 topped before oil did. In fact, the S&P 500 recorded its all-time high in October 2007 and was already down 21% by the time oil topped on July 11, 2008. In 2014, the S&P 500 recorded new all-time highs five months after oil started to decline.
The chart below plots oil against the S&P 500 and shows that falling oil prices are not consistently bearish for stocks. If history can be used as a guide, stocks are likely to hold up despite the oil meltdown."
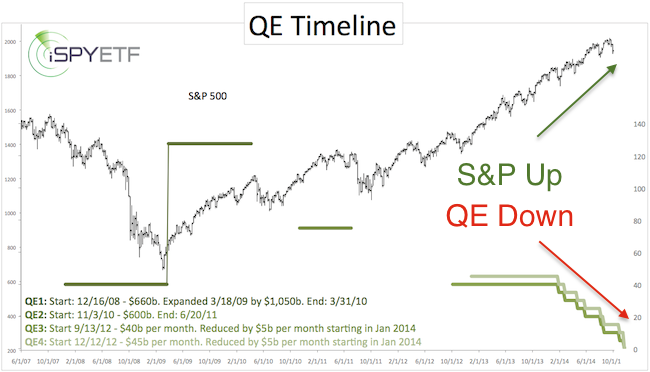
Unavoidable QE Bear Market
In 2008, the Federal Reserve unleashed it’s first round of Quantitative Easing (QE). A couple trillion dollars later, QE came to an end in October 2014.
Investors feared the withdrawal of QE would sink stocks (just like a junkie will crash without new fix).
The simplified logic (QE started this bull market, the end of QE will finish the bull market) seemed logical, but it wasn’t factual.
The October 5, 2015 Profit Radar Report plotted the QE money flow against the S&P 500 and concluded that: “We expect new bull market highs in 2015.”
Why?
The correlation between QE and stocks (at least in 2013/2014) did not support the notion of a bull market end. More importantly, our major market top indicator said the bull market is not over.
2016 Bear Market?
At the beginning of the year, when the S&P traded near 1,900, the media found countless of reasons why the bear market is finally here (many of them are listed here).
About six months and a 15% rally later, it’s obvious that the bull market is alive and well.
Short-term, the S&P has reached the lower end of our up side target range, so a pullback becomes more likely (more details here). However, any pullback should serve as a buying opportunity.
If you are looking for common sense, out-of-the-box analysis, check out the Profit Radar Report. It may just make you the best-informed investor you know.
Simon Maierhofer is the founder of iSPYETF and the publisher of the Profit Radar Report. Barron's rated iSPYETF as a "trader with a good track record" (click here for Barron's profile of the Profit Radar Report). The Profit Radar Report presents complex market analysis (S&P 500, Dow Jones, gold, silver, euro and bonds) in an easy format. Technical analysis, sentiment indicators, seasonal patterns and common sense are all wrapped up into two or more easy-to-read weekly updates. All Profit Radar Report recommendations resulted in a 59.51% net gain in 2013, 17.59% in 2014, and 24.52% in 2015.
Follow Simon on Twitter @ iSPYETF or sign up for the FREE iSPYETF Newsletter to get actionable ETF trade ideas delivered for free.

If you enjoy quality, hand-crafted research, >> Sign up for the FREE iSPYETF Newsletter
|
