December and January are usually the strongest months for stocks, so misfires – like in 2016 – are quite rare.
The S&P 500 closed down 4 of the last 5 trading days (last two days of the old year, and first three days of the New Year - Dec. 30, Dec. 31, Jan. 4, Jan. 5, Jan. 6).
Since 1970, that’s only happened three other times. 1977/78, 1990/91, and 2004/05. 2008 didn’t officially make the list, but the S&P was down 3 out of 5 days, and suffered the worst percentage loss.
The chart below shows how the S&P 500 fared after such poor year-end/New Year spurts.
If you enjoy quality, hand-crafted research, >> Sign up for the FREE iSPYETF Newsletter
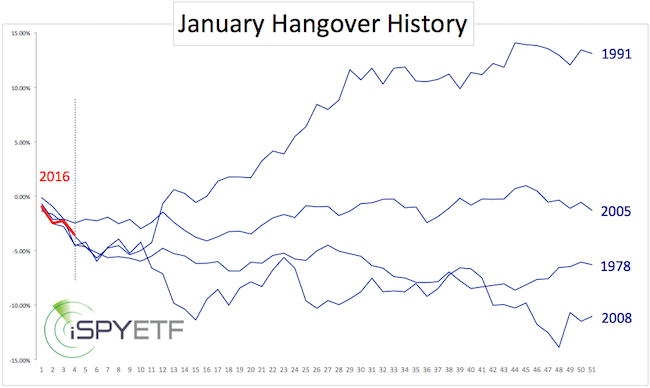
The sample size is small, but 2 out of 4 times things got worse. In 2005, the S&P stabilized, and in 1991 the S&P soared shortly thereafter.
Like 2016, 2008 was an election year with a second-term President.
The most plausible cause of this unusual weakness was discussed in detail here on November 2, 2015.
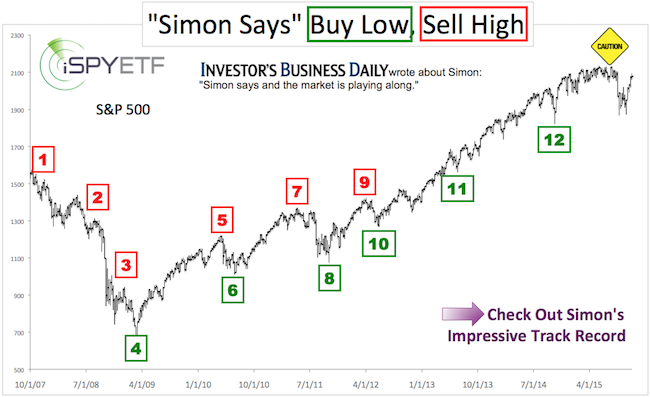
Simon Maierhofer is the publisher of the Profit Radar Report. The Profit Radar Report presents complex market analysis (S&P 500, Dow Jones, gold, silver, euro and bonds) in an easy format. Technical analysis, sentiment indicators, seasonal patterns and common sense are all wrapped up into two or more easy-to-read weekly updates. All Profit Radar Report recommendations resulted in a 59.51% net gain in 2013 and 17.59% in 2014.
Follow Simon on Twitter @ iSPYETF or sign up for the FREE iSPYETF Newsletter to get actionable ETF trade ideas delivered for free.
If you enjoy quality, hand-crafted research, >> Sign up for the FREE iSPYETF Newsletter
|
