Subscribers to iSPYETF’s free e-mail newsletter receive a market outlook, usually once a week. The market outlook below was sent out on February 25. If you’d like to sign up for the free e-newsletter, you may do so here (we will never share your e-mail with anyone, just as we don't accept advertising).
Last week's Market Outlook showed a mature 5-wave S&P 500 rally with the implication that risk is rising. We've also been keeping track of the 2021 similarity with 2020. Below is an updated year-to-date 2021/2020 S&P 500 performance chart.
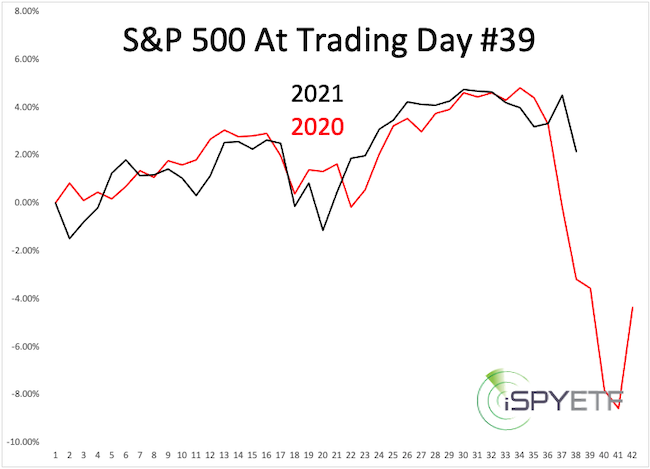
Of course I'm not naive enough to expect an exact repeat of 2021, but since investor sentiment is even more over-heated in 2021 than it was the same time last year, the down side risk is elevated and should not be ignored.
Up until late January, I was looking for more up side, but that has changed. I explained why in the February 14, 2021 Profit Radar Report:
"I spent hours analyzing the studies compiled and evaluated since February 1, and 11 of them project risk for the next month, only 2 favored reward. It’s a buying frenzy out there and rational analysis can be trumped by irrational behavior. A blow-off melt up before a return to normal jolts investors back into reality is possible. However, such a melt up is something an analyst allows for but doesn’t bet on."
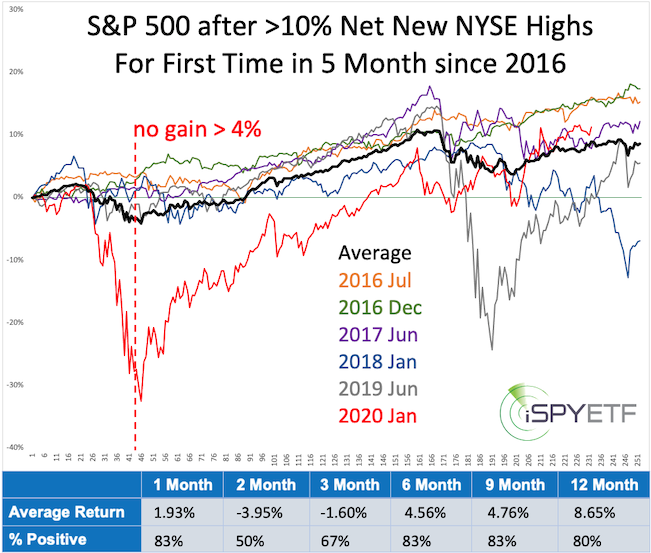
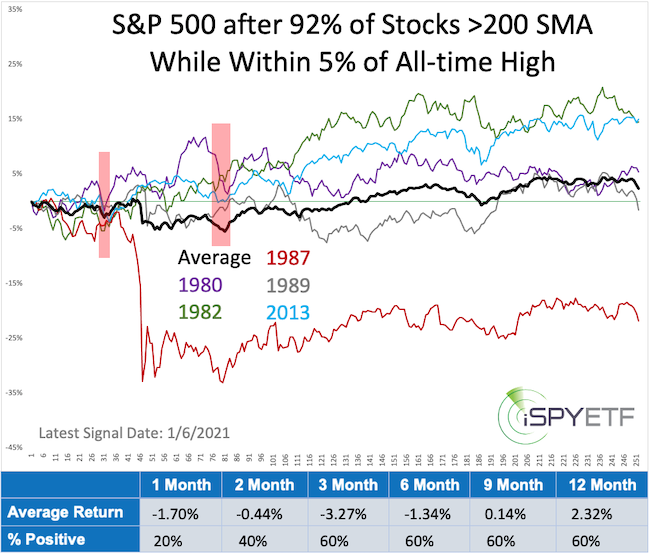
In addition to red hot enthusiasm a number of breadth studies even flashed a 'too much of a good thing' warning. Below are two of those studies published in the December 16, 2020 and January 17, 2021 Profit Radar Reports. Notice how forward returns of past precedents project weakness for Q1 2021 (red lines, bars).
Shorter-term, the DJIA is still close to the support/resistance trend line highlighted last week. If the Nasdaq-100 falls below 12,982 before rising above 13,476, the decline from the February 16 high will look like 5 waves and likely indicate a trend reversal. The short-term S&P 500 pattern is up to interpretation, but down side risk of the above studies looms over all major indexes.
If you are wondering what's going on with 30-year Treasuries and TLT, you may find my analysis from the March 15, 2020 Profit Radar Report of interest:
"Distrust in government is a global mega trend, with various government bond markets (especially Europe and Japan) being mainly supported by governments buying their own bonds. The US Treasury market may just have carved out a key reversal and perhaps major market top (which of course maybe postponed by today’s announcement to essentially resurrect QE and buy $700 billion worth of assets). In the land of the blind, the one-eyed person is king. The US equity markets may be the global ‘one-eyed’ go-to option."
Continued updates and the new 2021 S&P 500 Forecast are available via the Profit Radar Report.
The Profit Radar Report comes with a 30-day money back guarantee, but fair warning: 90% of users stay on beyond 30 days.
Barron's rates iSPYETF a "trader with a good track record," and Investor's Business Daily writes "Simon says and the market is playing along."
|
