Subscribers to iSPYETF’s free e-mail newsletter receive a market outlook, usually once a week. The market outlook below was sent out on December 15, 2022. If you’d like to sign up for the free e-newsletter, you may do so here (we will never share your e-mail with anyone, just as we don't accept advertising).
Which 5-letter word grabs investors' attention like no other?
Crash!
There've been a lot of crash warnings lately. Here is just a small sampling of headlines:
- This bear market rally could prompt a 2001-style crash
- As the reality of recession sinks in, prepare for market to crash
- Stock market crash: S&P 500 has 19% further downside
- Stock market crash warnings grow
- Stock market crash is coming even if US economy avoids recession
Most of the above headlines are already a few weeks old. Will today's drop finally usher in the much anticipated crash?
Over the past few weeks I've been pointing out 3 things:
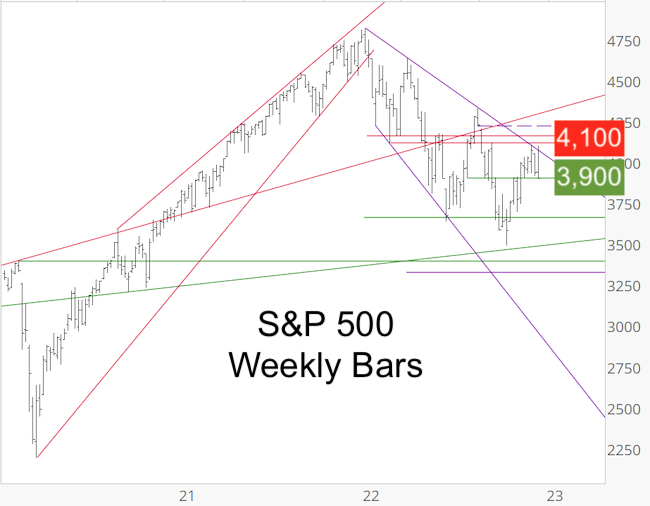
- There's resistance (acting as inflection zone) around 4,100
- Support is around 3,900
- Market action could be choppy, but pullbacks should recover
You may recall my exact words from the November 13 Profit Radar Report:
"Chart gaps at 4,083.67 and 4,218.70 remain open. The next serious resistance zone is around 4,100. Short-term support is around 3,900. A pullback can happen any moment and price action may well be choppy in coming days/weeks, but odds of further gains following pullbacks are good."
As the weekly chart shows, the S&P 500 tested resistance around 4,100 twice and is now - for the first time since November 10 - testing support around 3,900.

I'd like to point out that support around 3,900 has become quite obvious, which makes a seesaw across it more likely, and today's drop created another chart gap at 3,965.65 which should be closed in the not so distant future.
To sum up: The S&P 500 met resistance around 4,100 and reacted (first step of a reversal). The S&P is now testing support around 3,900 (potential second step of confirming reversal).
Although price is currently just below 3,900, I wouldn't consider this as second step to confirming a bearish reversal yet (due to seesaw risk).
Nevertheless, any potentially bullish patterns (or "odds of further gains") are on hold and more down side is possible as long as price stays below 3,900.
At this point, the decline from Tuesday's high looks like 3 waves. According to Elliott Wave Theory a 5-wave decline is needed to start confirming a trend change.
Continued updates and purely fact based research are available via the Profit Radar Report.
The Profit Radar Report comes with a 30-day money back guarantee, but fair warning: 90% of users stay on beyond 30 days.
Barron's rates iSPYETF a "trader with a good track record," and Investor's Business Daily writes "Simon says and the market is playing along."
|