The stock market’s H1 2023 performance caught many ‘market gurus’ by surprise.
Morgan Stanley had warned that the rally into January is another bear market trap.
Legendary manager Jeremy Grantham said that stocks could crash 50%.
Motley Fool predicted the following will happen in 2023:
- We will still be in a bear market by year’s end
- The U.S. will fall into a recession
- Apple will fall below $100
- A financial crisis will unfold.
What does the market have in store for the second half of 2023? Here is a look at various indicators.
All the charts and comments you are about to see were published at the beginning of the year in my 2023 S&P 500 Forecast.
Aren’t those charts outdated? Judge for yourself.
Exclusive Excerpts from the 2023 S&P 500 Forecast:
Valuations
The 2021 S&P 500 Forecast was the first one to comment on valuations. Why? Because many analysts warned that sky-high valuations will cause a crash. The Profit Radar Report didn’t disagree with sky-high valuations, but outlined 3 reasons why a crash was unlikely (Fed balance sheet, low interest rates, difficulty to peg fair value). The S&P ended 2021 with a 28.9% gain, so the 3 reasons obviously trumped valuation concerns.
Things, however, changed last year. The 2022 S&P 500 Forecast warned that: "Since the Fed is planning to unwind and reduce purchases (and shrink its balance sheet) in 2022, the risk of a more serious correction this year is much greater than in 2021."
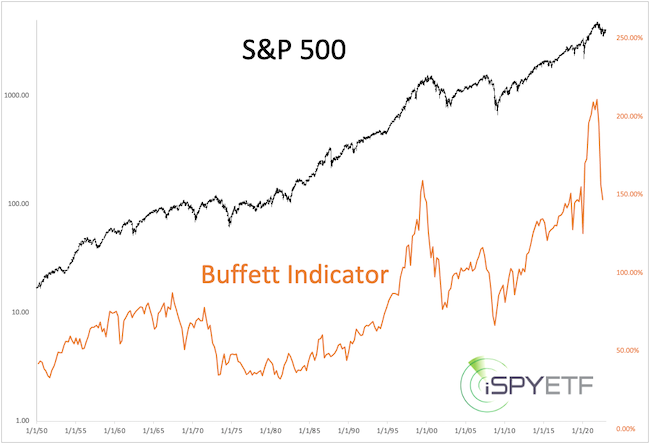
Below is an updated chart of the Buffett Indicator. The 2022 correction certainly reset valuations. Time will tell if the reset was sufficient enough for a major bottom, but valuations do not require a further stock market decline.
Breadth
Although there hasn’t been a particularly dense cluster of 90% or 80% up days (which we usually look for), multiple lesser known breadth thrusts (as defined by Walter Deemer or Wayne Whaley) triggered the first two weeks of January. This is rare, and forward performance after past signals has been exclusively positive.
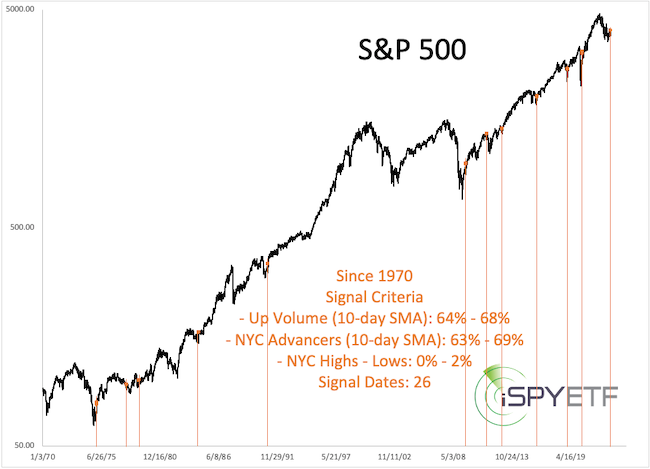
When we search for breadth readings very similar to mid-January (based on 10-day SMA of advancing stocks, advancing volume, and net new 52-week highs) we get only 11 prior signals. The exact criteria and and signals dates are shown below.
Forward performance has been remarkable. After a somewhat rocky first couple months, the S&P 500 was up every time 9 month after the signal with an average gain of 13.64%.
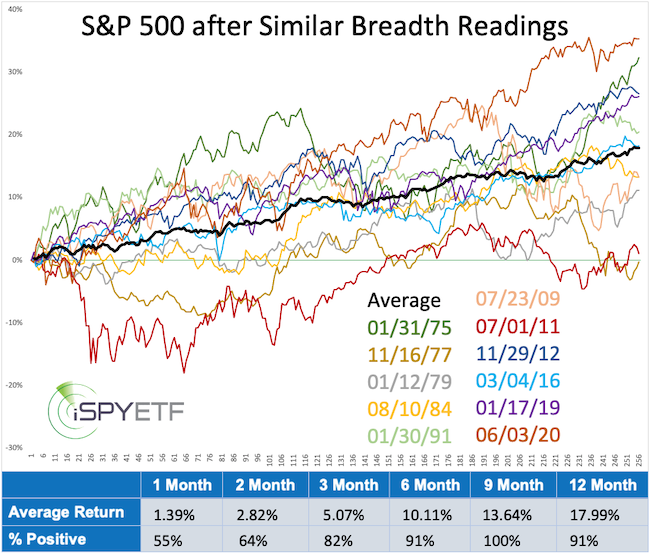
Chart gaps
Every single down side chart gap since the 2009 low has been closed. Knowing this has kept us bullish many times when others turned bearish (i.e. in 2020, 2018, 2015). Right now there is still an open chart gap at 4,218.17, and we expect this gap to be closed at some point. There is also on open chart gap for DJIA at 36,044.22.
Seasonality & Cycles
The 2022 S&P 500 Forecast stated: "2022 is the mid election year, which is the weakest of the 4-year presidential election year cycle. Historically (going back to 1950), the S&P 500 declines on average about 20% into the mid-term election year low.
The following year (the pre election year, 2023) is the strongest year of the election year cycle as incumbent presidents prime the pump to increase the odds of reelection. Historically, the S&P 500 gains on average about 50% from the mid election year low to the pre election year high.
Cycles project a fair amount of political and economic turmoil starting in Q1 of 2022. Based on seasonality and cycles, 2022 will be a tough year to navigate where high stocks prices early in the year should be used to raise cash for a better buying opportunity later in the year."
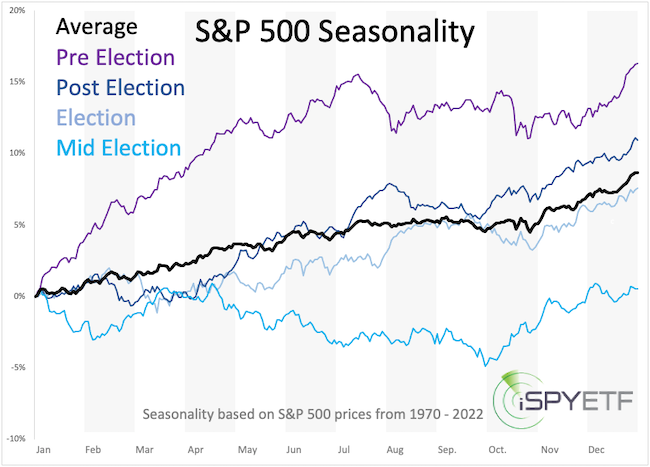
Shown below is the average performance for the 4 different years of the election cycles. We are now in the pre election year, which tends to sport the best performance. The S&P 500 is up 13.8% since the October low. This is a respectable bounce, but a 50% rally (average gain from mid election low to pre election high) projects 5,365.
A S&P rally beyond 5,000 is not impossible, but ambitious and seemingly unlikely based on the global picture. It is possible that bullish pre election seasonality will be counterbalanced by negative cycles to create more of a neutral balance.
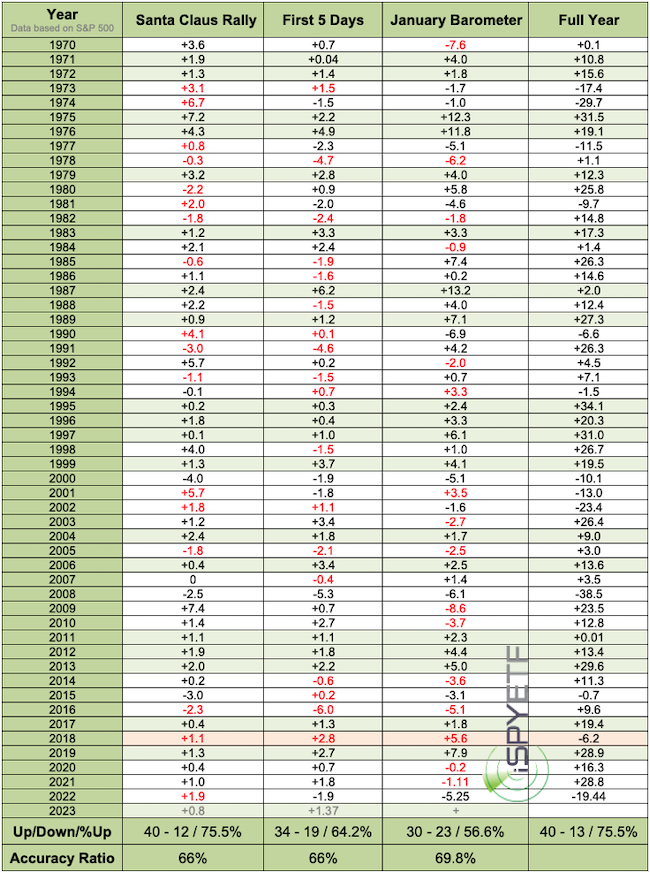
S&P 500 Barometers
The Santa Claus Rally (SCR) delivered a 0.8% gain, the First 5 Days of January (F5J) a 1.37% gain, and the January Barometer (JB) is likely to show a positive result as well.
Since 1970, the SCR, F5J and JB were all positive 20 other times. 19 times, the S&P 500 finished the year in positive territory (highlighted in green), once (2018, highlighted in orange) with a loss. Based on these barometers, there’s a 95% chance the S&P will end 2023 with a + before the final return figure.
Elliott Wave Theory (EWT)
Every indicator waxes and wanes in terms of effectiveness. EWT has been on a waning cycle (decreasing effectiveness). Perhaps that’s due to algo trading, fed intervention, or EWT getting too popular for its own good.
Fact is, patterns have been ambiguous for much of the past few years and analyst interpretations and projections have been all over the place (quite frequently diametrically opposed). EWT can still be helpful, but one has to be selective, discerning and most of all open minded to the weight of evidence.
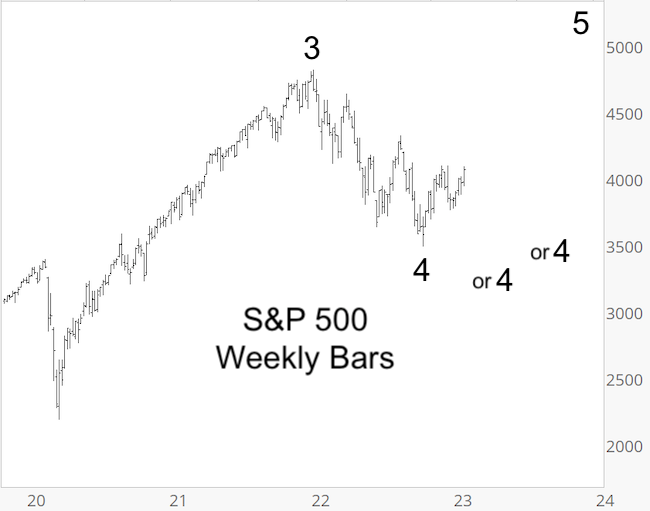
The pattern of the decline from the January 2022 high is, once again, up to interpretation. It could be a sloppy 5-wave decline (indicative of a change of trend) or a 3-wave decline (indicative of a correction followed by new all-time highs).
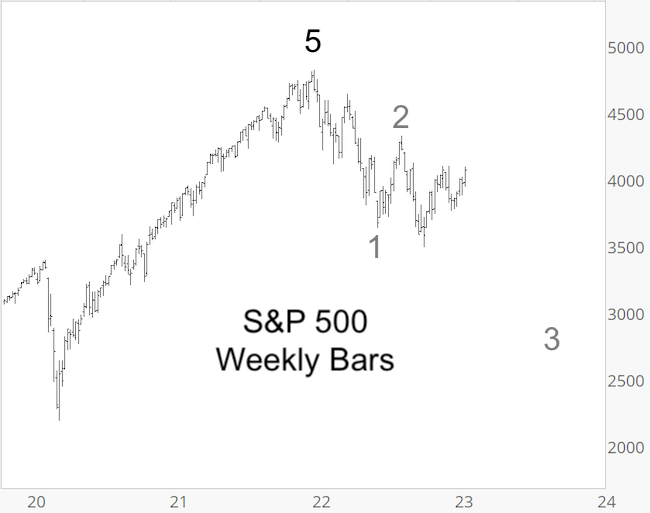
This forecast will not list all the EWT interpretations in circulation. Rather, the chart below lumps the different variations into two categories:
The 2022 decline is part of a correction (wave 4) that will eventually be followed by new all-time highs. Waves 4 are notoriously choppy and hard to predict. Wave 4 could already have ended at the October low or it could drag on for many more months. Regardless, the down side would be limited to somewhere around the October 2022 low.
The 2022 high is the end of the bull market (wave 5). A bear market is unraveling with the worst part of the bear market (wave 3) likely to be seen in 2023. This scenario is possible and we will watch for tell-tale signals, but based on the weight of evidence it is less likely than scenario #1.
Summary
Here are the key takeaways from the indicators discussed above:
- If the S&P can break above 4,100, the next resistance and inflection zone is at 4,218 - 4,350.
- Inflection zones are likely to cause a reaction (turn down or turn up price), but unless key support is broken, the S&P could move towards the 2022 all-time highs.
- There is an open DJIA chart gap at 36,044 (5.7% above current price), which likely will be closed at some point.
- Seasonality, breadth, S&P 500 barometers, sentiment and breadth-based studies suggest higher prices. The bearish EWT scenario, cycles, economic indicator-based studies suggest lower prices. These forces may neutralize each other, leaving a small bullish bias.
- We do not expect a S&P 500 break below support at 3,500 - 3,300.
- The overall range bound 2023 S&P 500 projection reflects our positive bias tempered by the tug of war between conflicting indicators and money flow forces. A break above resistance (4,350) or below support (initially 3,750) is needed for a potential break out or break down. End of 2023 S&P 500 Forecast
H2 2023 S&P 500 Forecast
The extended trading range earlier this year followed by the June S&P 500 breakout proved the "neutral with slightly bullish bias" oulined by the 2023 S&P 500 Forecast correct.
However, the S&P 500 has reached, and exceeded, the 4,350 target range. While I remain overall positive, the zone surrounding 4,350 is also an inflection zone where risk of a pullback is elevated.
I will monitor the pullback risk along with all the other indicators to update the S&P 500 Forecast.
For continued updates, purely fact based research, and objective analysis, sign up for the Profit Radar Report.
The Profit Radar Report comes with a 30-day money back guarantee, but fair warning: 90% of users stay on beyond 30 days.
Barron's rates iSPYETF a "trader with a good track record," and Investor's Business Daily writes "Simon says and the market is playing along."
|
