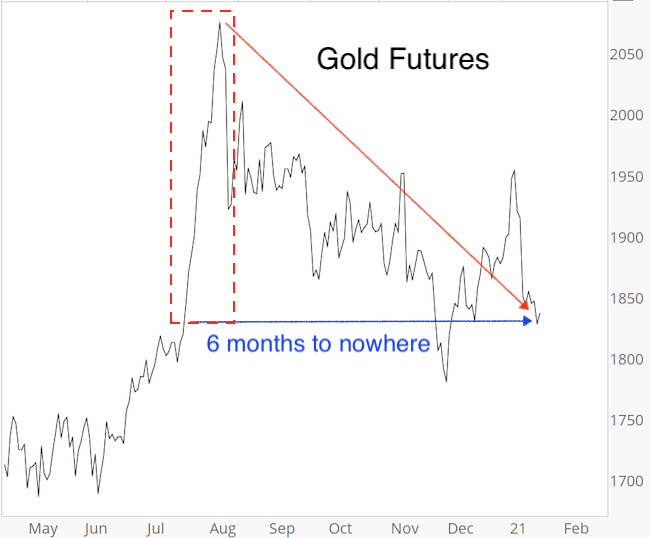
After quite a rollercoaster ride, gold prices are exactly where they were six months ago. More interesting than the 6-month trip to nowhere is that gold has given up all the (blow off top?) July/August 2020 gains (red box).
Does that mean gold is ready to rally once again?
I did not expect to see gold surge over 250 points into the August 6 2020 high, but wan't surprised to see the subsequent losses.
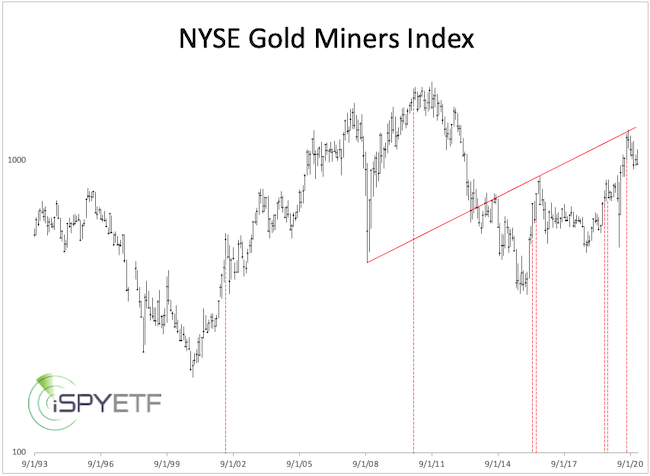
I published the NYSE Gold Miners Index chart below in the July 29, 2020 Profit Radar Report along with the red resistance line and times when 90% of gold miner index stocks were above their 50-and 200-day SMAs with more than 50% of them at a 52-week high (dashed red lines). 2 months later, the Gold Miners Index was down 75% of the time.
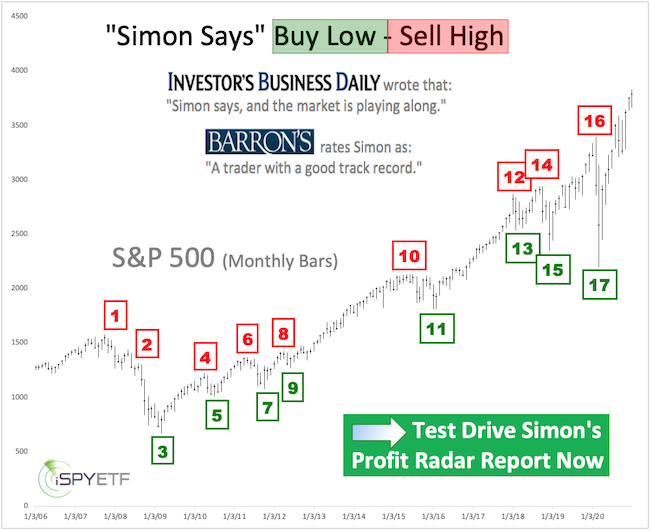
Barron's rates iSPYETF as "trader with a good track record" and Investor's Business Daily says: "When Simon says, the market listens." Find out why Barron's and IBD endorse Simon Maierhofer's Profit Radar Report
The August 19, 2020 Profit Radar Report compared the latest gold rally with the 10 most closely correlated gold rallies. The chart below plotted the corresponding forward returns. As the performance tracker (bottom bar) shows, 2 month later gold was up only 10% of the time, 3 and 6 month later only 30% of the time.
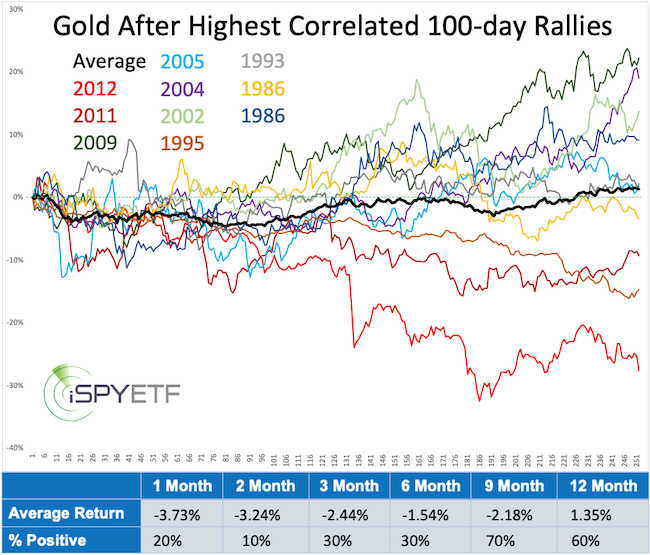
Past performance is no guarantee of future performance, but the correlation study has proven to be very insightful and accurate.
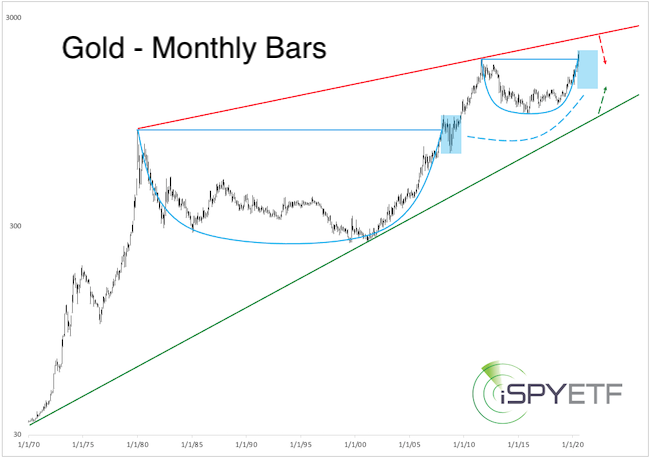
Long-term, gold could be forming the handle (blue box) of a bullish cup and handle formation (like 1980 - 2009) as illustrated in this chart (published in the August 16, 2020 Profit Radar Report).
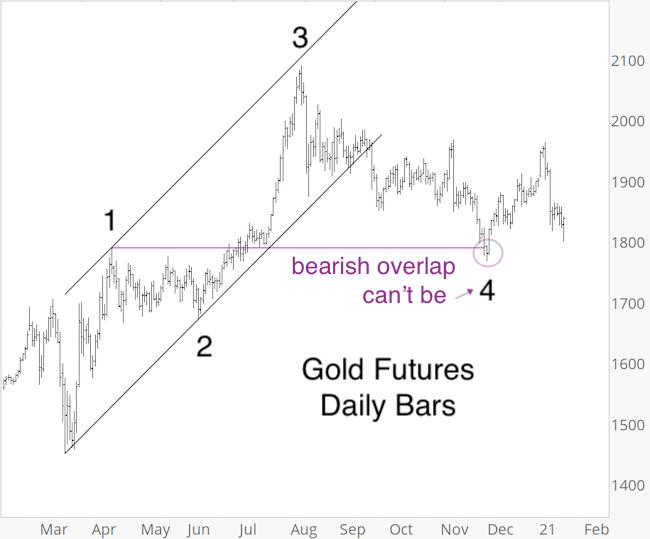
Mid-term, gold fell below the April 14, 2020 high, which invalidates a bullish 5-wave Elliott Wave Theory pattern from the March 16, 2020 low.
While another bounce is likely once this leg lower is complete, confidence in a new all-time high within the first half of 2021 is sub-par.
Continuous updates are available via the Profit Radar Report.
Simon Maierhofer is the founder of iSPYETF and the publisher of the Profit Radar Report. Barron's rated iSPYETF as a "trader with a good track record" (click here for Barron's evaluation of the Profit Radar Report). The Profit Radar Report presents complex market analysis (S&P 500, Dow Jones, gold, silver, euro and bonds) in an easy format. Technical analysis, sentiment indicators, seasonal patterns and common sense are all wrapped up into two or more easy-to-read weekly updates.
|