Who or What is Fibonacci?
Every human is equipped with free will, yet a vast majority of mankind are subject to crowd behavior. Every human is different, yet a vast majority of mankind is fascinated or pleased by certain reoccurring patterns. Every person has a different DNA, yet the general physical proportions of the 7+ billion living human bodies are strikingly similar.
A reoccurring proportion in the human body is a person’s height divided by the distance between the foot and the navel or the distance between the finger tip and the elbow in proportion to the distance between the wrist and the elbow.
Beautiful faces generally sport the same proportion between the length and width of face. Leonardo da Vinci’s painting of Mona Lisa reflects this proportion. Mona Lisa is world famous because it is said to be aesthetically pleasing to the human eye (even though Mona Lisa is not pretty per say).
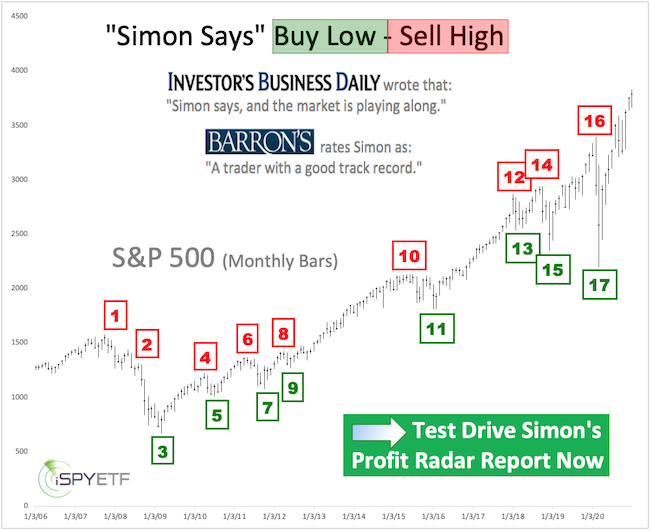
Barron's rates iSPYETF as "trader with a good track record" and Investor's Business Daily says: "When Simon says, the market listens." Find out why Barron's and IBD endorse Simon Maierhofer's Profit Radar Report
Leonardo da Pisa, an Italian mathematician born around 1,170, better known as Leonardo Fibonacci or just Fibonacci, is the best-known person to put a finger on this aesthetically pleasing proportion and express it mathematically as Phi. Phi with an upper case “P” is 1.618, phi with a lower case “p” is 0.618 (both numbers are irrational).
A Truly Unique Number
Fibonacci established a sequence of natural numbers, later named after him. The Fibonacci sequence starts out like this: 0, 1, 1, 2, 3, 5, 8, 13, 21, 34, 55, 89, 144, etc. Each number of the sequence is a sum of two preceding numbers. The ratio of each successive pair of numbers in the series approximates Phi. The ratios of successive numbers in the series quickly converge on Phi. After the 40th number in the series, the ratio is accurate to 15 decimal places. Fibonacci numbers have certain defining properties:
Division of the preceding number by the subsequent numbers tends to 0.618. Division of the subsequent number by the preceding number tends to 1.618. Division of a number by the second preceding number tends to 2.618. Division of a number by the second subsequent number tends to 0.382.
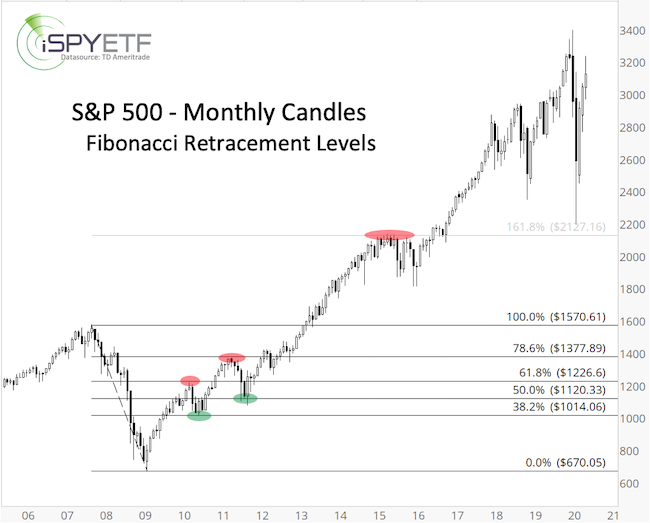
Phi has a unique place among numbers as it is the bridge between addition and multiplication. If you add unity or 1 to phi (0.618) you get Phi (1.618). If you multiply 1.618 by 0.618 you get 1. If you multiply 0.618 by itself you get 0.382. If you multiply 1.618 by itself you get 2.618. Phi is a uniquely reciprocal relationship between two unequal parts of a whole, in which the smaller part (38.2%) stands in the same proportion to the larger part (61.8%), as the larger part stands to the whole (see chart above).
If you enjoy quality, hand-crafted research, sign up for the FREE iSPYETF e-newsletter & market outlook
Fibonacci Everywhere?
Because of the widespread appearance of Phi in the universe, humans, animals, plants, DNA, music, the Bible and ancient architecture, Phi has been called the Golden Section, Golden Number, Divine Proportion, Divine Section, Golden Mean or Golden Ratio.
In biology, we find that a majority of flowers are adorned with a Fibonacci number of petals. Lilies have 3, buttercups 5, delphinium 8, Marigold 13 and sunflowers either 34, 55 or 89 depending on size. Sunflower seeds are arranged in a number of clockwise and anti-clockwise spirals containing 55 and 89 seeds.
The Golden Ratio is also found in architecture and can be seen in the Great Pyramids in Egypt, the Parthenon in Greece, Notre Dame in Paris, Taj Mahal in India, the CN Tower in Toronto and the United Nations building in New York. It could be said that the Golden Ratio is in our DNA - literally. The DNA molecule, the program for all life, is based on the Golden Mean. It measures 34 angstroms long by 21 angstroms wide for each full cycle of its double helix spiral. 34 and 21 are numbers in the Fibonacci series and their ratio closely approximates Phi.
Fibonacci and the Markets
It is generally agreed upon that perception is one of the most powerful forces influencing stock prices. Perception is a reflection of social mood and prices are an expression of value created by the collective mind of investors. In an attempt to give the intangible more substance and create a level of comfort we create charts, candle stick formations, trend lines, moving average and other exotic tools.
Consciously or subconsciously, mankind and investors/traders find themselves drawn to shapes governed by the Golden Mean. Since the Divine Proportion literally permeates our DNA, the aesthetics found in nature, art, architecture and music resonates with us. It is not surprising to see this fascination extend into technical analysis and investment behavior. After all, such shapes and formations can be found in stock charts.
Many research resources acknowledge the market's respect for Fibonacci relationships but can't explain why. And while humans allure to the Golden Mean will remain an unsolved mystery, hopefully this brief synopsis has provided a small glimpse why Fibonacci proportions have merit in the investment world.
There are various ways to incorporate Fibonacci concepts into technical analysis. Below are two I like to use.
Fibonacci Retracement
Fibonacci retracement ratios are created by taking two extreme points (top and bottom or vice versa) on a stock chart and dividing the vertical distance by the key Fibonacci ratios of 23.6%, 38.2%, 50% or 61.8%. Based on these levels, horizontal lines are drawn to identify Fibonacci support/resistance levels. Fibonacci retracements can be powerful tools as proportionalities found in nature often transcend into financial markets.
Fibonacci retracements are fractal and can be used at various degrees. A long-term Fibonacci retracement I like to use is the rally from the March 2009 low in proportion to the preceding decline from the 2007 top.
From October 2007 to March 2009 the S&P 500 lost 909.3 points by plunging from 1,579.09 to 666.79. On the subsequent rally to and beyond new all-time highs, the S&P 500 reacted to many different Fibonacci retracement levels (red and green ovals).
Fibonacci Projections
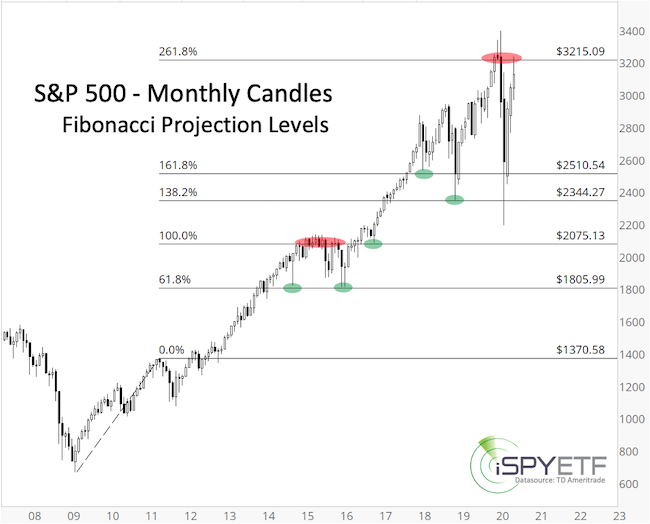
The purpose of Fibonacci projections is to determine price targets and potential trend exhaustion points.
Example: Following the initial up leg of the 2009 rally one could have run a Fibonacci projection to identify the bullish upside objective of what turned out to be a new (secular) bull market. Bullish Fibonacci projections tend to be most reliable when the projection is based upon the first wave based on Elliott wave criteria (see segment on Elliot Wave Theory).
The chart below shows the Fibonacci Projectino levels that first served as resistance, and later on as support (red and green ovals).
Additional research and updates, projections, buy/sell recommendations are available via the Profit Radar Report.
Simon Maierhofer is the founder of iSPYETF and the publisher of the Profit Radar Report. Barron's rated iSPYETF as a "trader with a good track record" (click here for Barron's evaluation of the Profit Radar Report). The Profit Radar Report presents complex market analysis (S&P 500, Dow Jones, gold, silver, euro and bonds) in an easy format. Technical analysis, sentiment indicators, seasonal patterns and common sense are all wrapped up into two or more easy-to-read weekly updates.
|