Subscribers to iSPYETF’s free e-mail newsletter receive a market outlook, usually once a week. This market outlook below was sent out on April 29. If you’d like to sign up for the free e-newsletter, you may do so here (we will never share your e-mail with anyone, just as we don't accept advertising).
There's a Wall Street adage that says: "Never short a dull market."
Boy, has it been a dull market. One way to spot a dull market is when you don't receive a Thursday e-mail from me (like last Thursday). This may be silly, but I respect people's inboxes and only send out updates when I feel like there's something worth writing (or when I didn't send one out last week).
Anyway, is the adage never to short a dull market true?
First, let's define dull. From Monday - Wednesday the S&P 500 average maximum daily percentage change (based on closing prices) was 0.09%. Yeah, let's call that dull.
The yellow lines in the chart below mark every time (since 2014) when the maximum daily % change (3-day SMA) was 0.10% or less (we'll call this the signal).
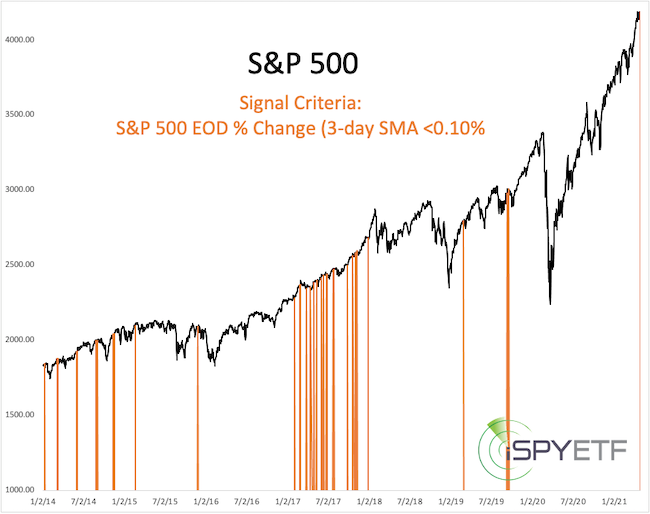
Although this week was the first signal since 9/19/2019, it happened many time before. Throughout 2017, it was a good idea not to short a dull market, but shorting a dull market 2014 - 2016 would have yielded positive short-term returns most of the time.
In short, it's better to know the facts than trust an adage. That's, by the way, what the Profit Radar Report is all about, getting the facts of what's really going on.
Talking about facts, the stock market has delivered some rare phenomena recently, like:
- Very bullish breadth readings and all-time highs
- Incredibly low volume
I wanted to find out:
-
If breadth has gotten so good (too good to be true) that it's actually a negative
-
If new all-time highs on record low volume are bearish for stocks.
My findings along with S&P 500 forward returns after similar setups in the past are available here: What are the Implications of Rare Stock Market Phenomena?
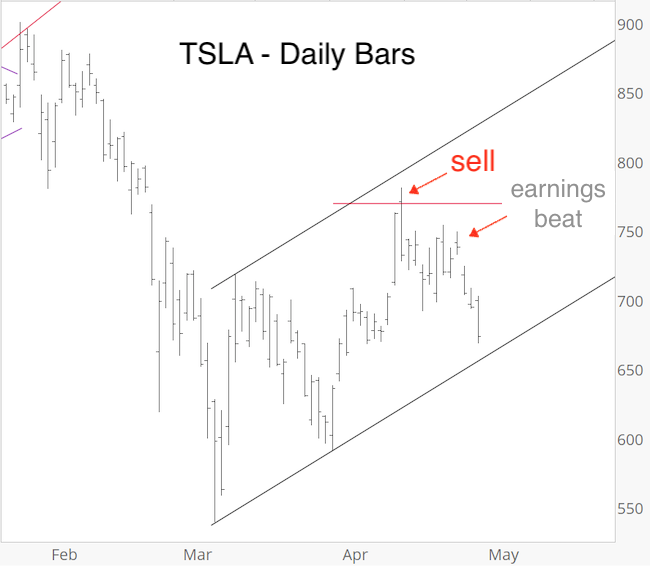
The April 15 Free Market Outlook highlighted shorting TSLA as the new FOMO trade. The entire April 15 Market Outlook along with the rationale to short TSLA was posted here.
The chart below shows how TSLA has done since I recommended shorting it on April 14. What's real 'curious' is that TSLA's decline accelerated after it delivered a solid earnings beat.
This is one reason why I tend to ignore earnings. Two, even better reasons, (one of them being the Buffett Indicator) for ignoring earnings - and perhaps more importantly sky high valuations - are discussed here: 3 Reasons for Ignoring Earnings and Valuations
Continued updates, out-of-the box analysis and forward performance based on historic precedents are available via the Profit Radar Report.
The Profit Radar Report comes with a 30-day money back guarantee, but fair warning: 90% of users stay on beyond 30 days.
Barron's rates iSPYETF a "trader with a good track record," and Investor's Business Daily writes "Simon says and the market is playing along." What makes the Profit Radar Report unique?
|
