Subscribers to iSPYETF’s free e-mail newsletter receive a market outlook, usually once a week. The market outlook below was sent out on April 2, 2024. If you’d like to sign up for the free e-newsletter, you may do so here (we will never share your e-mail with anyone, just as we don't accept advertising).
100-day Anniversary
The stock market rally from last year's low just celebrated its 100-day anniversary. And what a 100+ days it's been. The S&P 500 gained 27% during that time and delivered one of the most resilient up trends ever.
You probably remember that this rally started out with a Zweig Breadth Thrust (ZBT). I wrote about it here (Triggered! The Gold Standard of Signals) and published the study below in the November 8, 2023 Profit Radar Report.
The image shows the S&P 500 performance after each prior ZBT signal. The various graphs show the post signal trajectories and the performance tracker (blue table) shows the actual S&P 500 returns and percentage of positive reactions.
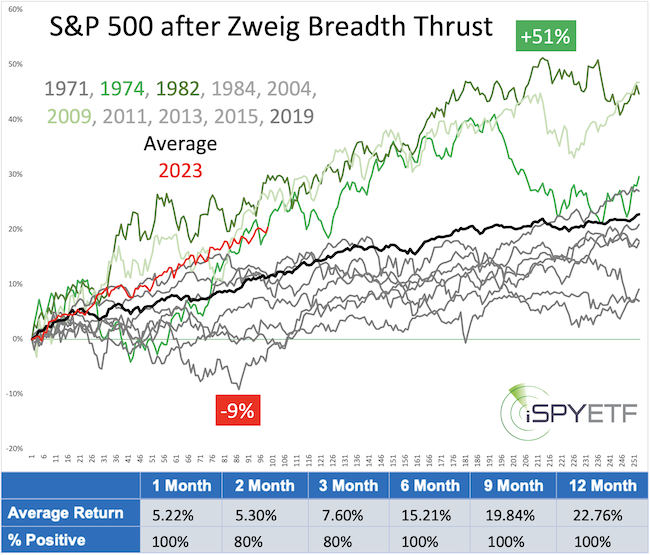
Even a brief glance at the graphs and performance tracker explain why I called the ZBT the 'gold standard of signals.' The chart is updated to show the following:
1) S&P 500 return after the 11/3/2023 signal (red graph)
2) The best prior post-signal returns (various shades of green)
A comparison of the red and green graphs reveals that the performance following the November 3, 2023 signal rivals the best ZBT returns over the last 50 years.
I try to keep those newsletters short, and without too much bragging about prior calls, but if you'd like to know what the Profit Radar Report stated back in November of last year - when this rally was still in its infancy - you will find a section with two fascinating excerpts at the bottom of this newsletter.
The key question after a historically strong rally is this: Do melt-ups lead to melt-downs?
To get the best possible answer, we will:
- Identify similar S&P 500 rallies in the past based on 3 criteria
- Show how the S&P 500 reacted to similar conditions
- Project past performance into the future (like the performance tracker above
Yes, we all know the worn disclaimer that past performance is no guarantee of future performance. And it's true, but how the stock market reacted to a very specific set of conditions in the past - especially when past reactions are consistent - often projects a rough future path (see the above ZBT projection, published 5 months ago).
Identify criteria: Since the October, 2023 low, the S&P 500 has accomplished 3 rare feats:
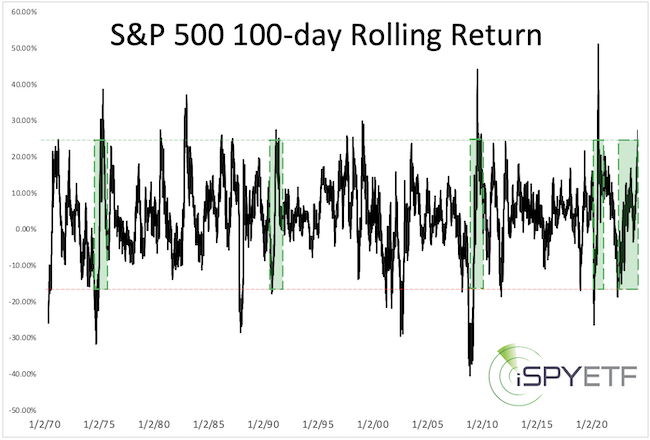
1) The S&P 500 gained 27% in 100 days. In fact, the rolling 100-day return jumped from -18.6% to 27.3%. This has happened only 4 other times (since 1970, see first chart below).
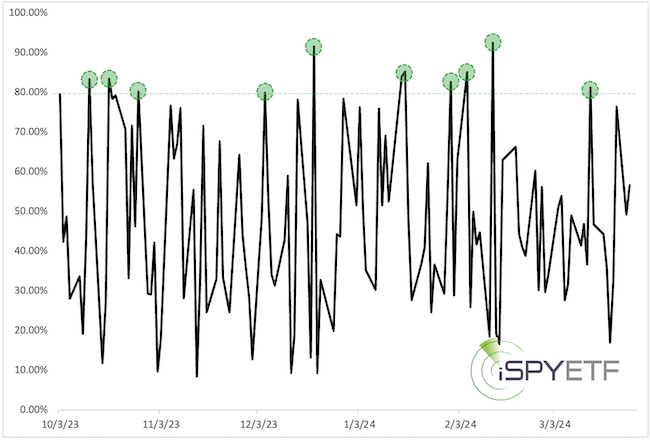
2) The first 100 days of that rally included 11 days with up volume of 80% or more (since 1970, see second chart below)
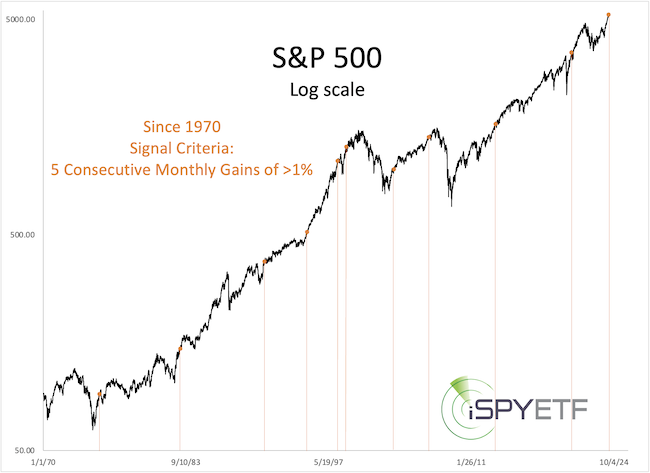
3) The S&P 500 ended March with a 3.1% gain, the fifth consecutive month with a gain of 1% or more. This happened only 10 other times since 1970.
We now use the above 3 rare feats as criteria (with some adjustments to the 100-day return study to increase the sample size).
In order to make the study more robust while keeping the results diversified, I combined criteria #1 & #2 into one study and criteria #3 into a separate study.
The criteria #1 + #2 study returned 12 signal dates, the criteria #3 study returned 11 signal dates. Keep in mind that's for a lookback period of 54 years (going back to 1970). Anything around 10 is the perfect signal size, not too small, not too big.
Shown below are the 11 signal dates for the criteria #3 study. It's tough to squeeze 54 years of history into one chart, but the signal dates already provide a rough idea.
The study gets even more telling when looking at the performance tracker (which includes average returns and odds for positive returns for the next 1, 2, 3, 6, 9, 12 months).
The performance tracker for both studies, but especially for the criteria #1 + #2 study, are powerfully consistent and a must know for everyone invested in stocks.
The complete analysis with performance tracker for both studies is available via the March edition of the Profit Radar Report.
The Profit Radar Report comes with a 30-day money back guarantee, but fair warning: 90% of users stay on beyond 30 days.
Barron's rates iSPYETF a "trader with a good track record," and Investor's Business Daily writes "Simon says and the market is playing along."
Excerpt from the November 19, 2023, Profit Radar Report:
Trust is a precious commodity, it is earned and not just extended equally to everyone ... at least that’s the case in my personal and financial analysis life.
I always try to look at the complete picture and build a body of evidence. Every indicator is included in the Risk/Reward Heat Map as either bullish or bearish factor for a specific time period. But not every indicator receives the same amount of trust or consideration.
Elliott Wave Theory (EWT), for example, has not earned or received a lot of our trust lately, and rightfully so (some EWT analysts are backpedaling now and finding bullish interpretations where there were none a few weeks ago).
One of the most trusted (although least know) ‘indicators’ have been chart gaps. And once again it appears like our trust in chart gaps getting filled was well-placed. At this point, the open S&P 500 chart gap is only 53.51 points away. I won’t take much to remove this indicator and the implied 'up side guarantee.’ If the gap gets closed, we hope a new one will open if and before the market decides to decline.
Based on the historic track record, the Zweig Breadth Thrust (ZBT) - discussed in the November 8 and 11 PRRs - deserves a fair amount of trust as well. In terms of up side target, the ZBT is not nearly as specific as open chart gaps, but it tells us that the odds strongly favor rising stocks. Based on the post-ZBT price trajectory, this overall bullish outlook deserves our trust as long as the S&P 500 does not close below 4,100.
Excerpt from the November 11, 2023, Profit Radar Report:
As outlined in the July 23, PRR, we anticipated a summer correction. We didn’t know how deep the correction would be, but we knew that price would eventually come back and close the open chart gaps. For example, the August 6, August 27, September 24 PRRs all made comments similar to this one (from August 6):
“The most important thing to watch, at this point, is the open S&P 500 chart gap at 4,567.53. As long as it remains open (and we hope it does), we are very confident that any losses (and we hope we’ll see more) will be retraced and there will be an eventual buying opportunity.”
Rather than being side-tracked by many cross currents, now may be the time to keep it simple and focus on this:
- We got the summer correction we expected.
- We got a breadth thrust that sets up our expectation of “any losses to be retraced.”
- We got what we hoped for. Next up should be a rally to close the gap at 4,567.53.
As detailed in Wednesday’s (November 8) PRR, the S&P 500 has not lost more than 5% following a Zweig Breadth Thrust within the first few months of the signal (November 3). Deducting 5% from the November 3, S&P close at 4,358.34 brings us to 4,140.42, which is close to the October low at 4,103.78. For simplicity, we will assume that the trend is up as long as the S&P 500 does not close below 4,100.
|
