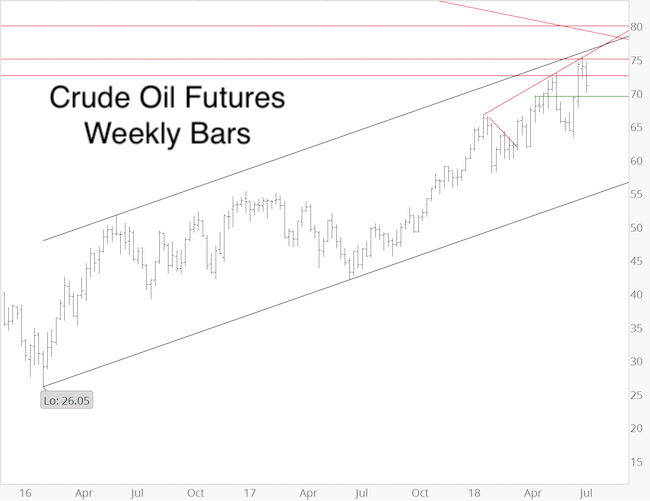
As crude oil has been nearing the top of its trend channel, we’ve been looking for low-risk opportunities to short oil.
The proximity to trend channel resistance is not the only reason for our bearish disposition however.
Investors have become increasingly more bullish on oil, and trade seems to be nearing the end of a wave 4 rally (according to Elliott Wave Theory).
Waves 4 are choppy and unpredictable. In fact, this wave 4 has gone on further than we expected.
In an attempt to provide some clarity, the Profit Radar Report published the chart below on June 24.
Barron's rates iSPYETF as "trader with a good track record" and Investor's Business Daily says: "When Simon says, the market listens." Find out why Barron's and IBD endorse Simon Maierhofer's Profit Radar Report.
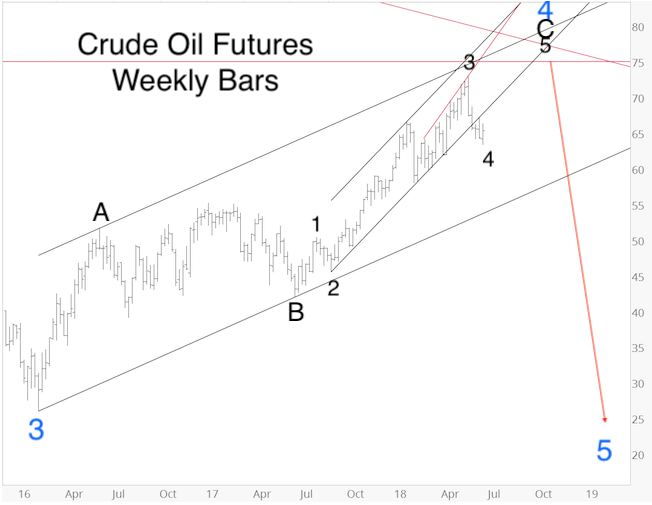
Based on this interpretation of the wave structure, oil needed one more rally above 75 before a massive decline.
The July 1 Profit Radar Report stated that:
“This is another window of opportunity for oil to turn lower, however, another strong close would likely erase the short-term RSI-35 and on balance volume divergence. A quick spike to 75 followed by an intraday reversal would be a picture perfect beginning of a reversal with significant down side potential (see June 20 PRR).
Not all signals are alligned for a good sell signal, but it's worth taking a stab.
We will short crude oil if it moves above 75 on Monday or Tuesday or short the United States Oil Fund (USO) if it moves above 15.20 on Monday or Tuesday.”
If you enjoy quality, hand-crafted research, >> Sign up for the FREE iSPYETF Newsletter
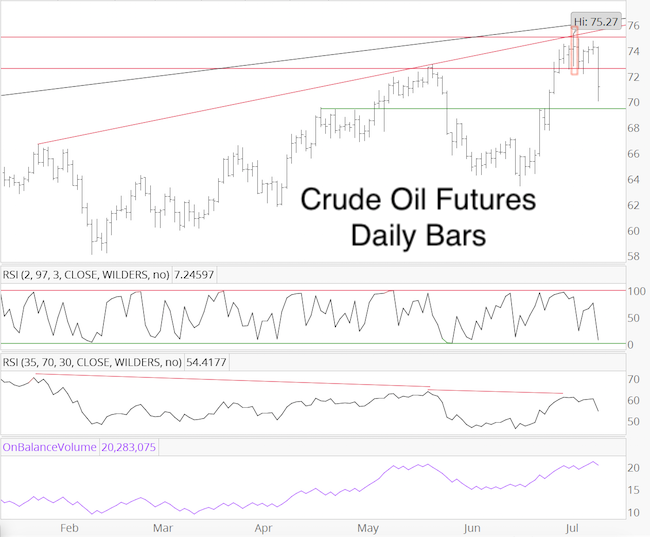
On Tuesday, July 3, crude oil briefly spiked above 75 (USO above 15.20) before reversing lower.
As seen on the weekly chart, there’s another strong resistance cluster just below 80. We can’t yet rule out a move to this level.
For now we got an excellent low-risk entry point to go short, and as long as trade remains below Fibonacci resistance at 72.55, we are looking for lower prices (next support: 69.50). Continued updates for oil, gold, silver, US dollar and stocks are available via the Profit Radar Report.
Simon Maierhofer is the founder of iSPYETF and the publisher of the Profit Radar Report. Barron's rated iSPYETF as a "trader with a good track record" (click here for Barron's profile of the Profit Radar Report). The Profit Radar Report presents complex market analysis (S&P 500, Dow Jones, gold, silver, euro and bonds) in an easy format. Technical analysis, sentiment indicators, seasonal patterns and common sense are all wrapped up into two or more easy-to-read weekly updates. All Profit Radar Report recommendations resulted in a 59.51% net gain in 2013, 17.59% in 2014, 24.52% in 2015, 52.26% in 2016, and 23.39% in 2017.
Follow Simon on Twitter @ iSPYETF or sign up for the FREE iSPYETF Newsletter to get actionable ETF trade ideas delivered for free.
If you enjoy quality, hand-crafted research, >> Sign up for the FREE iSPYETF Newsletter
|
