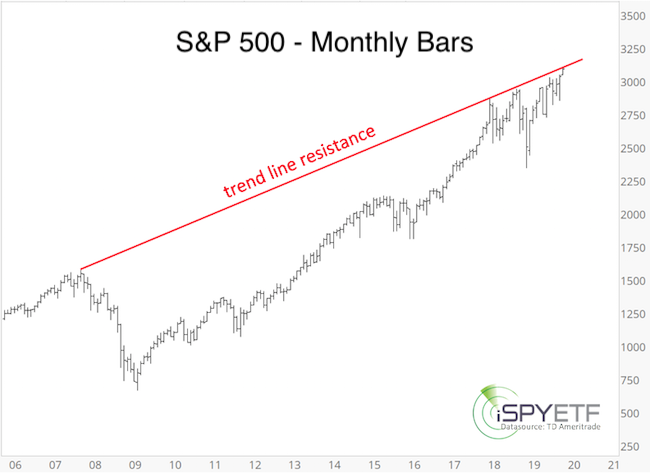
The S&P 500 has arrived at major trend line resistance (see chart). Will it relapse lower or climb above?
To answer this question, we’ll look at various indicators:
-
Investor sentiment
-
Market breadth & liquidity
-
Seasonality & cycles
-
Technical analysis
Investor sentiment - Obsession with Recession
The August 25 Profit Radar Report pointed out various bearish sentiment extremes - including that google searches for ‘recession’ spiked to the highest level since 2008 - and warned that stocks are likely to rally to flush out investors’ obsession with recession (for more details and chart go here: "Today's stock market pessimism is a reliable sign of a stock market rebound").
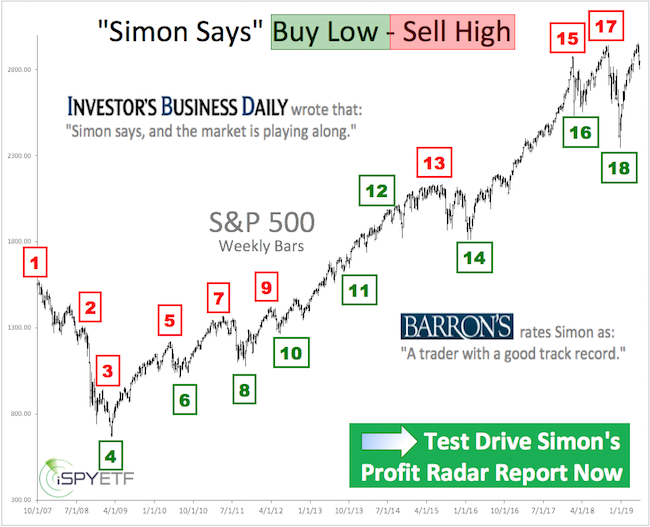
Barron's rates iSPYETF as "trader with a good track record" and Investor's Business Daily says: "When Simon says, the market listens." Find out why Barron's and IBD endorse Simon Maierhofer's Profit Radar Report.
The >150-point rally since certainly alleviated recession fears and turned investors more bullish.
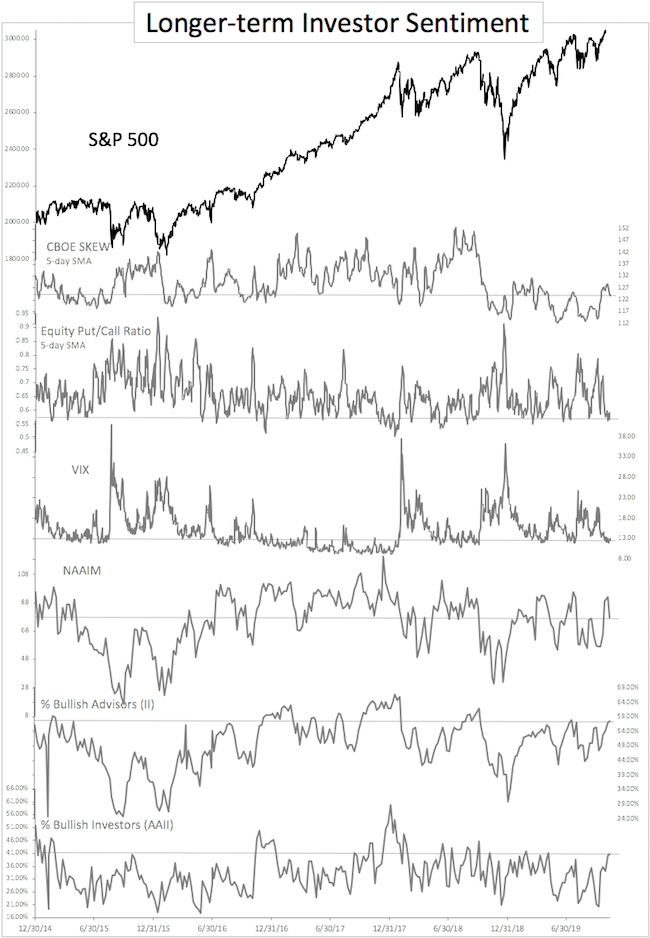
The chart below plots the S&P 500 against 6 longer-term sentiment gauges.
The second chart plots the S&P 500 against 4 shorter-term sentiment gauges.
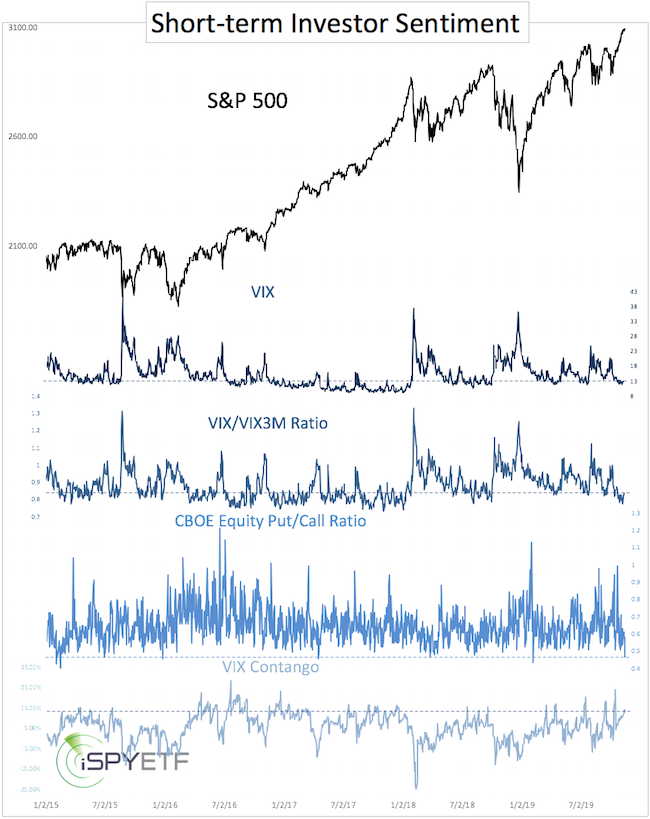
Sentiment summary: Sentiment is not frothy enough where it eliminates the possibility of further gains, but it now is more of a headwind than tailwind and more likely to curb gains and cause a pullback.
Market Breadth & Liquidity
The S&P 500 reached new all-time highs on four of the last eight trading days (November 5 - 14). But, on six of the eight days, more stocks declined then advanced.
If you enjoy quality, hand-crafted research, >> sign up for the FREE iSPYETF e-newsletter & market outlook
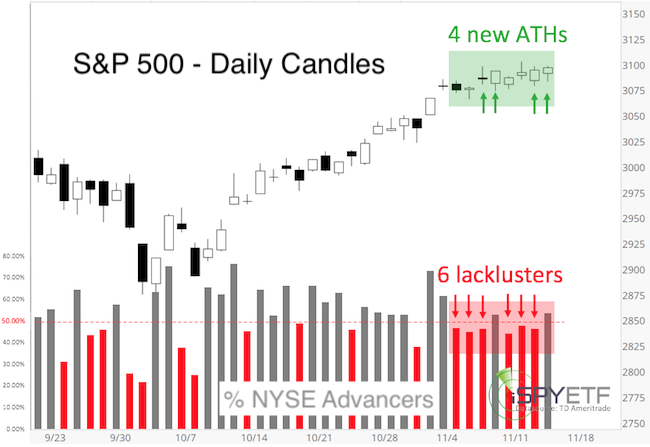
There’s weakness ’under the hood,’ and it caused a number of bearish divergences shown on the chart below.
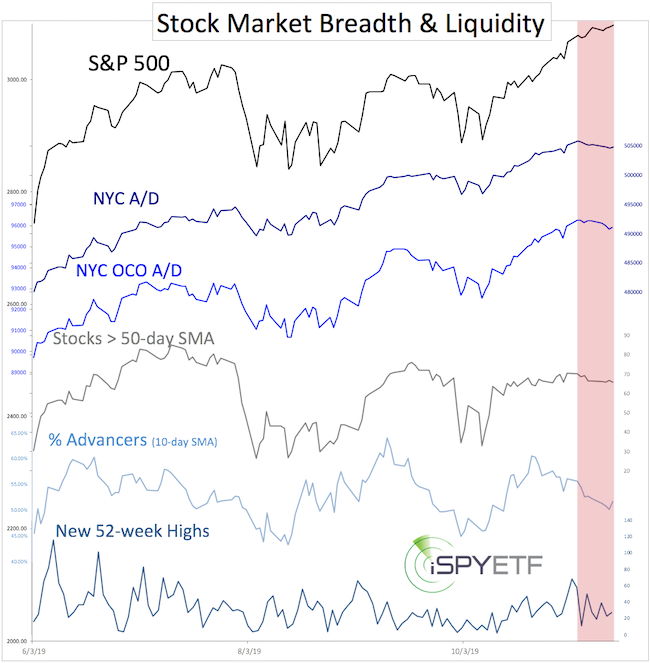
Bearish divergences can be erased quickly, but while they exist, they reveal a measure of weakness often seen prior to pullbacks.
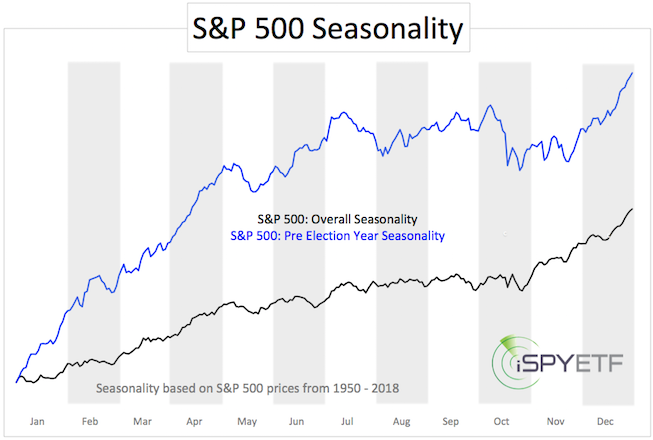
Seasonality & Cycles
In terms of seasonality, the S&P 500 has passed the riskiest period of the year. However, cycles do not agree with the bullish year-end seasonality.
Technical analysis
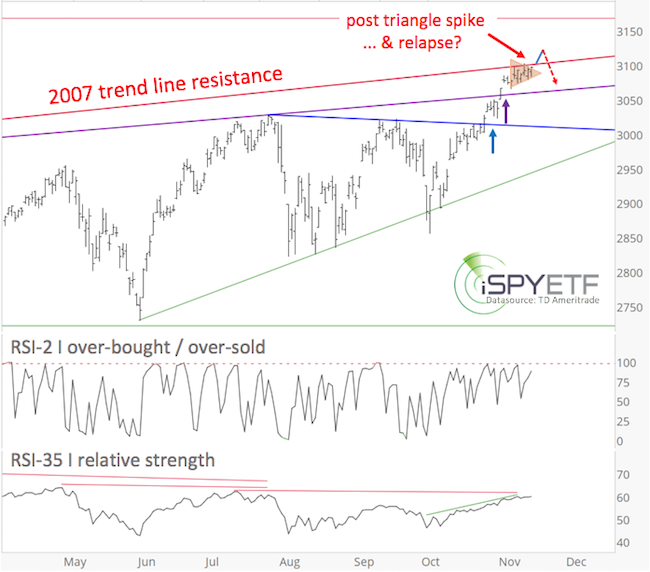
The chart below highlights all the levels highlighted by the recent Profit Radar Reports:
If you enjoy quality, hand-crafted research, >> sign up for the FREE iSPYETF e-newsletter & market outlook
-
Blue trend line: Potential resistance, but move above will lead to test of purple trend line
-
Purple trend line: Potential resistance, but move above will unlock higher targets
-
Red trend line: Potential resistance, but move above allows for further gains.
Although the yellow triangle formation cautions that a move above red trend line resistance will not last.
Initial target for any pullback will be the purple trend line. A break below the purple trend line is needed to get lower targets.
Summary
The S&P 500 is at red trend line resistance. A temporary move above (post triangle spike) seems likely, but the risk of a relapse and test of purple trend line support (at minimum) is high. A break back below red trend line resistance (assuming there will be a spike above it) is needed to signal a reversal.
Continued updates, projections, buy/sell recommendations are available via the Profit Radar Report.
Simon Maierhofer is the founder of iSPYETF and the publisher of the Profit Radar Report. Barron's rated iSPYETF as a "trader with a good track record" (click here for Barron's evaluation of the Profit Radar Report). The Profit Radar Report presents complex market analysis (S&P 500, Dow Jones, gold, silver, euro and bonds) in an easy format. Technical analysis, sentiment indicators, seasonal patterns and common sense are all wrapped up into two or more easy-to-read weekly updates. All Profit Radar Report recommendations resulted in a 59.51% net gain in 2013, 17.59% in 2014, 24.52% in 2015, 52.26% in 2016, and 23.39% in 2017.
|