Short-term S&P 500 Analysis
In the April 7 Profit Radar Report I introduced a very simple approach to analyzing the S&P 500. See chart and commentary below:
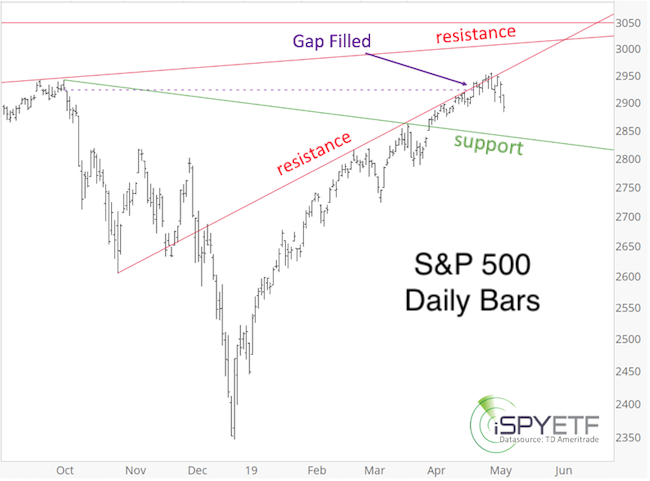
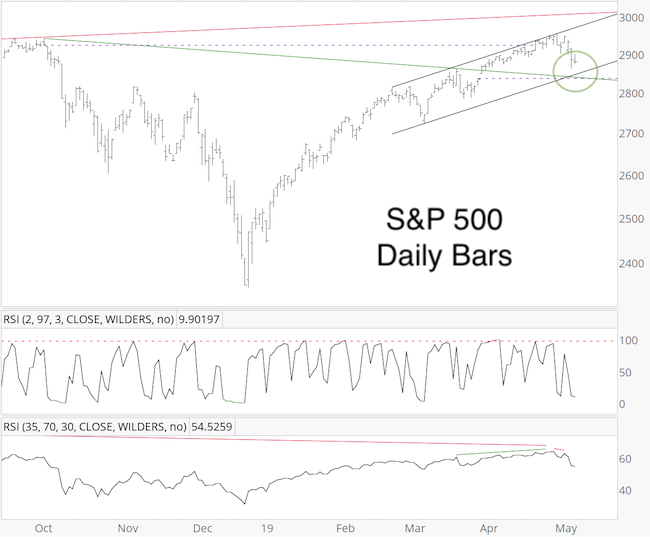
“Red trend line resistance has held thus far, and has not become main stream enough to be negated. Green trend line is near-term support. An immediate break above trend line resistance may lead to closure of the open chart gap (2,921.36).”
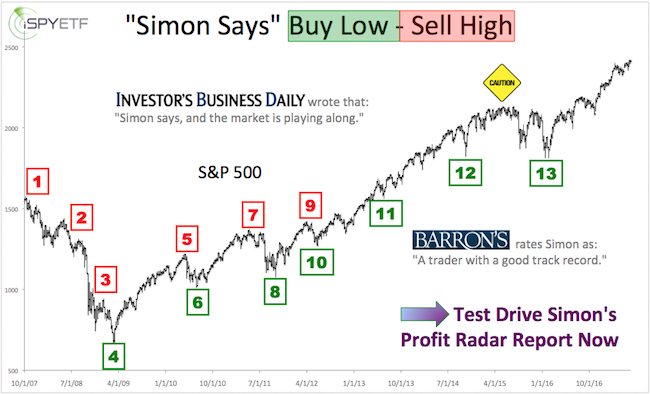
Barron's rates iSPYETF as "trader with a good track record" and Investor's Business Daily says: "When Simon says, the market listens." Find out why Barron's and IBD endorse Simon Maierhofer's Profit Radar Report.
Troughout April, the S&P has been clinging to the red trend line like a tourist hooked to a zip line. Chart gaps are not reversal levels, but they are like magnets, and once that gap was filled on April 17, there was one less reason for the S&P to move higher.
The April 14 Profit Radar Report warned that: “Technicals do not indicate an immediate break down, and trade may continue to grind higher. However, any gains are likely to be slow and choppy, and risk of a drop lower – where a one-day drop can erase days or weeks of gains – exists.”
Longer-term S&P Analysis
The first few trading days of May erased almost all of April’s gains. But more importantly, prior to the May drop, the S&P 500 actually reached a new all-time high.
This new high was the minimum requirement outlined in my 2019 S&P 500 Projection (published in the 2019 S&P 500 Forecast, see below).
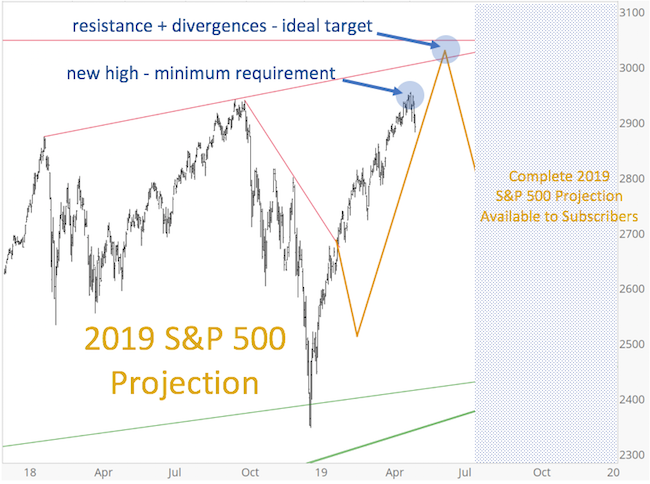
Why was a new all-time high ‘required?’ As explained in the 2019 S&P 500 Forecast, there were not enough bearish divergences for a major market top at the September 2018 high.
If you enjoy quality, hand-crafted research, >> Sign up for the FREE iSPYETF e-Newsletter
New all-time highs – as projected – were the only possible way to reconcile this.
Even though the S&P has reached the minimum requirement before a larger (and quite possibly nasty) pullback, the yellow projection carries the S&P 500 to trend line resistance around 3,000.
My preferred scenario was featured in the May 1 Profit Radar Report (see below). Based on this scenario, the S&P would drop to 2,890 – 2,865 (in wave 4) and rally towards 3,000 (in wave 5).
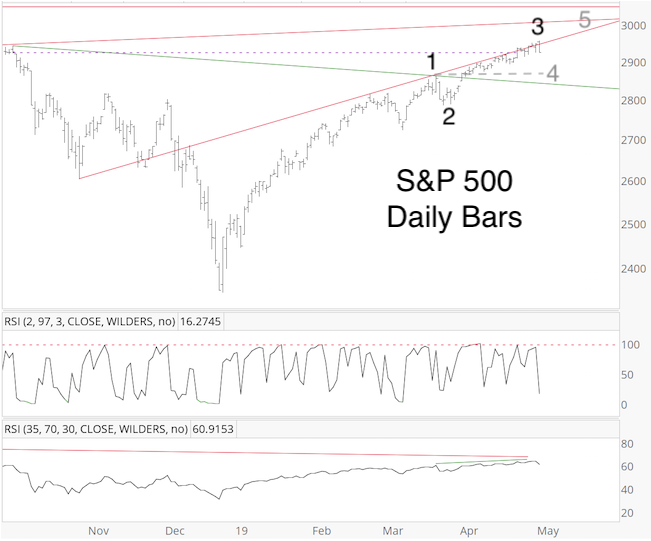
Why is this my preferred scenario? Because waves 4 (especially when comparatively long-winded) tend to drag down high breadth and momentum readings (seen at wave 3 highs), which creates the bearish divergences usually seen at the wave 5 top (although the upcoming top should be noteworthy, I don’t expect this to be a major market top).
There was a bearish RSI divergence at the April 30 closing high, which could be enough for a sizeable drop, but a more pronounced set of divergences at higher prices would be a clearer signal.
Summary
The expected down side risk became reality, and the S&P may continue lower, but the 2,890 – 2,865 zone is where a rally to about 3,000 may start.
UPDATE (May 8, 2019)
The S&P 500 fell below the March 21 high at 2,860.31. This means the current decline can not be wave 4, because wave 4 is not allowed to overlap wave 1 (see chart above).
Tuesday's special Profit Radar Report update warned that the S&P 500 Futures already suffered an overlap (which made the S&P 500 more likely to follow) and today's (Wednesday) Profit Radar Report published the chart below and stated:
"Recent PRRs mentioned the role of the March 21 high at 2,860.31. A drop below (which has already happened for S&P 500 Futures) voids the 5-wave structure from the March 8 low, but it opens the door for other short-term Elliot Wave Theory based interpretations. At least one of them still allows for more weakness and new all-time highs. The chart below shows some additional support around 2,850 – 2,840 and a chart gap at 2,836.03."
Once the S&P gets close to support and the open gap, odds for a bounce will be elevated.
Continued updates are available via the Profit Radar Report
Simon Maierhofer is the founder of iSPYETF and the publisher of the Profit Radar Report. Barron's rated iSPYETF as a "trader with a good track record" (click here for Barron's evaluation of the Profit Radar Report). The Profit Radar Report presents complex market analysis (S&P 500, Dow Jones, gold, silver, euro and bonds) in an easy format. Technical analysis, sentiment indicators, seasonal patterns and common sense are all wrapped up into two or more easy-to-read weekly updates. All Profit Radar Report recommendations resulted in a 59.51% net gain in 2013, 17.59% in 2014, 24.52% in 2015, 52.26% in 2016, and 23.39% in 2017.
|