The latest S&P 500 all-time high clocked in at 2,440 as the S&P 500 continues to plow over bearish forecasts
Will the S&P 500 in particular, and stocks in general, continue to slog higher?
Here is our comprehensive forecast based on the “four stock market engines:”
-
Supply & demand (liquidity)
-
Technical analysis
-
Investor sentiment
-
Seasonalities and cycles
Supply & Demand
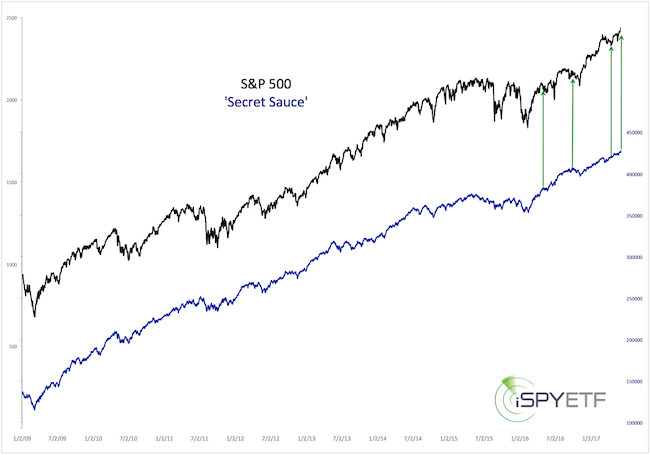
We first unveiled our favorite liquidity indicator in 2014. This indicator correctly foreshadowed the 1987, 2000 and 2007 market top and – aside from a timely caution signal in 2015 – persistently pointed towards continued bull market gains.
Barron's rates iSPYETF as "trader with a good track record" and Investor's Bussines Daily says "When Simon says, the market listens." Find out why Barron's and IBD endorse Simon Maierhofer's Profit Radar Report.
For readers of our free website, we’ve dubbed this indicator ‘secret sauce.’ Why, and how this indicator is used is explained here.
In short, major market tops have been preceded by bearish divergences (S&P 500 rallies to new all-time highs, secret sauce does not).
Throughout 2016 and 2017 however, there’ve only been bullish divergences (secret sauce rallies to new all-time highs, but the S&P 500 lags behind). The last four times this happened was on April 30, and April 9, 2017, September 22, and April 16, 2016 (see green arrows).
Each time the Profit Radar Report stated that: “[Secret sauce] is already at new highs. The S&P 500 will soon follow.”
Secret sauce just confirmed the latest S&P 500 high, which means a major market top is still many months away (this doesn’t mean we can’t see a correction though).
Technical Analysis
The most exotic ‘tool in the technical analysis box’ has also been the most accurate: Elliott Wave Theory. Therefore we will focus on Elliott Wave Theory for this update.
The charts below were initially published in the August 28, 2016, Profit Radar Report, and have been our roadmap ever since as the S&P moves toward 2,500.
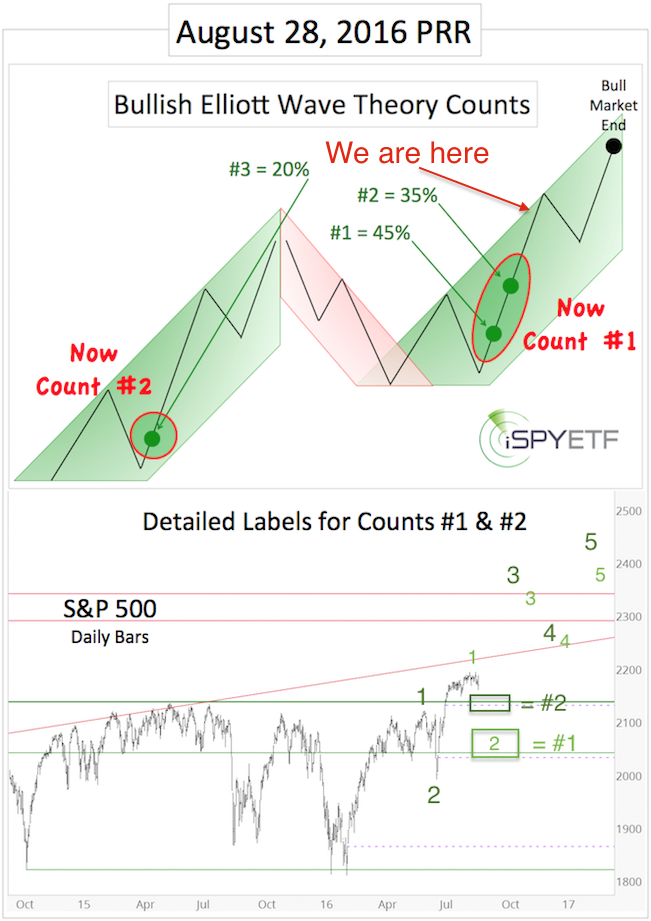
We have made some minor adjustments recently, which places the S&P near the beginning of a more pronounced, choppy correction (see ‘we are here’ on top graph). This correction would be labeled as wave 4 (likely intermediate degree).
If you enjoy quality, hand-crafted research, >> Sign up for the FREE iSPYETF Newsletter
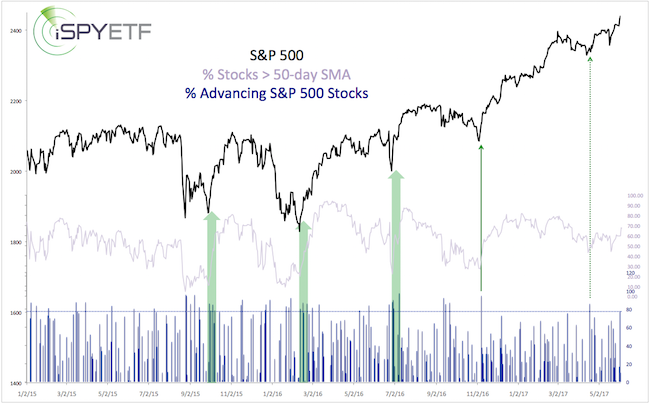
Despite rising prices, there has been a measure of internal weakness (see chart below). There have been no strong up days (90% days, where 90% or more of volume flows into advancing stocks). The percentage of stocks above their 50-day SMA is also lagging.
This is compatible with a rally that’s nearing a (temporary) point of exhaustion.
Investor Sentiment
The chart below provides a long-term comparison between investor sentiment near the 2007 high and today.
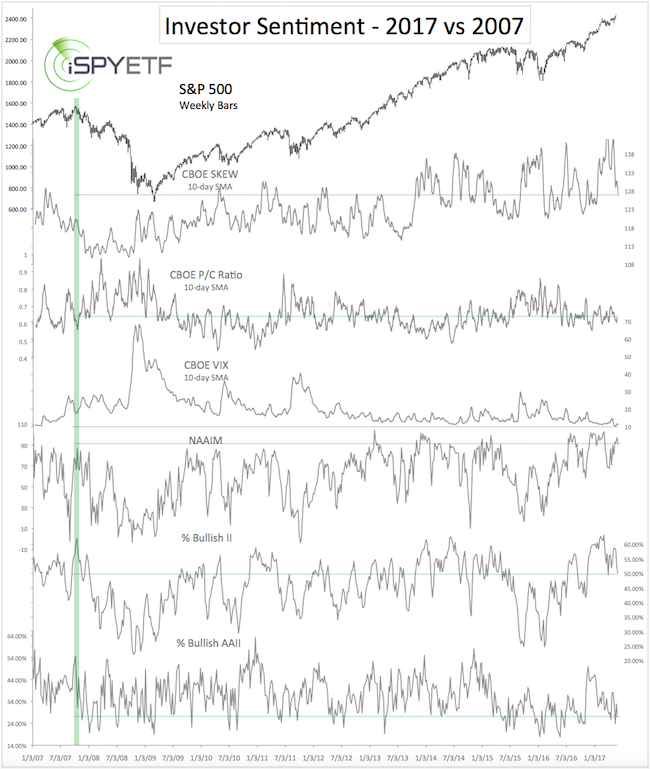
In short, investors are not as euphoric about stocks today as they were in late 2007. Based on investor sentiment, stocks are not at a major market top.
In fact, stocks may still benefit from the pessimistic extremes seen in January/February 2016 (when the S&P traded below 1,900).
The January 29, 2016 Profit Radar Report stated that: “Sentiment turned pessimistic enough to become a bullish tailwind for the coming months.”
Seasonality & Cycles
Cycles project weakness later on in 2017 and seasonality is hitting a soft spot until September/October.
Conclusion
Once the S&P 500 reaches our up side target we will be looking for a more pronounced correction, but not the end of this bull market.
Continuous updates and actual buy sell recommendations (we haven’t had a losing trade since June 2015) are provided via the Profit Radar Report.
S&P 500 up side targets are discussed here.
Dow Theory is setting up for a bearish divergence
Simon Maierhofer is the founder of iSPYETF and the publisher of the Profit Radar Report. Barron's rated iSPYETF as a "trader with a good track record" (click here for Barron's profile of the Profit Radar Report). The Profit Radar Report presents complex market analysis (S&P 500, Dow Jones, gold, silver, euro and bonds) in an easy format. Technical analysis, sentiment indicators, seasonal patterns and common sense are all wrapped up into two or more easy-to-read weekly updates. All Profit Radar Report recommendations resulted in a 59.51% net gain in 2013, 17.59% in 2014, and 24.52% in 2015.
Follow Simon on Twitter @ iSPYETF or sign up for the FREE iSPYETF Newsletter to get actionable ETF trade ideas delivered for free.

If you enjoy quality, hand-crafted research, >> Sign up for the FREE iSPYETF Newsletter
|
