The last S&P 500 update highlighted the bearish implications of trend line resistance and the ominous VIX wedge.
I reiterated the importance of this trend line in the July 28 Profit Radar Report when stating that: "We are looking at many indicators, but the purple trend line - boring as it may seem - is probably more helpful than other gauges at this point."
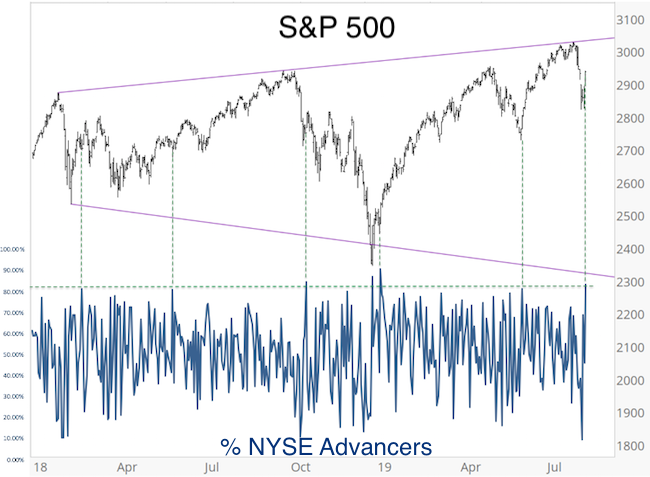
The S&P 500 fell over 200 points after tagging purple trend line resistance (see 'before and after' charts below).
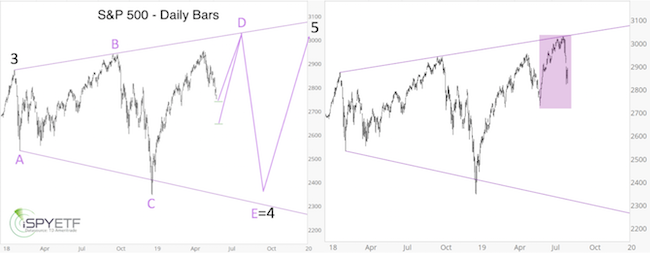
Obviously, the purple trend line worked, but will the S&P 500 tumble another few hundred points as implied by the expanding triangle pattern (wave E shown on left)?
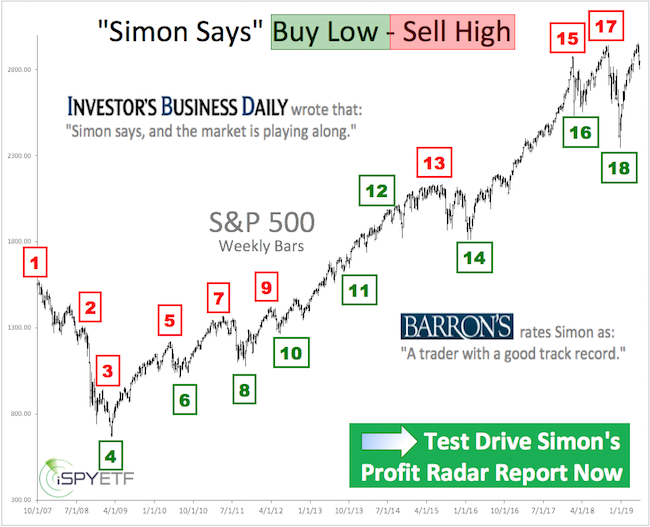
Barron's rates iSPYETF as "trader with a good track record" and Investor's Business Daily says: "When Simon says, the market listens." Find out why Barron's and IBD endorse Simon Maierhofer's Profit Radar Report.
Here are a few other facts and indicators to help gauge the odds:
New Lows
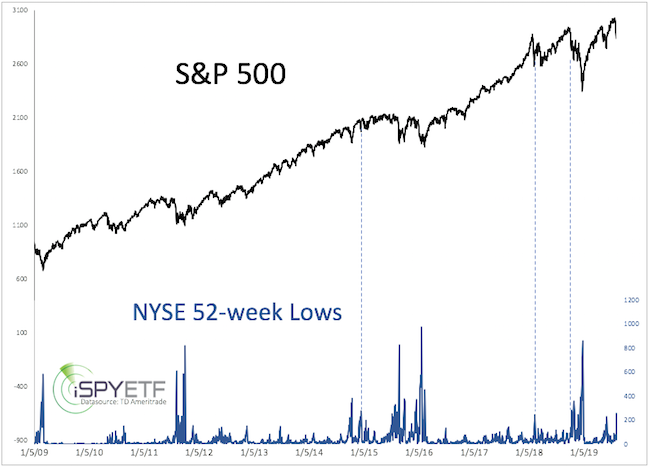
On Monday, 249 NYSE-traded stocks fell to new 52-week lows. This is the highest reading of 2019. In fact, it’s very unusual for such high 52-week low numbers to occur so soon after the S&P 500 was at an all-time high. The blue lines in the chart below show other times when 52-week lows spiked above 240 when the S&P was within 10 trading days of a 52-week high. It wasn’t a good sign for stocks.
If you enjoy quality, hand-crafted research, >> Sign up for the FREE iSPYETF e-Newsletter
Technicals
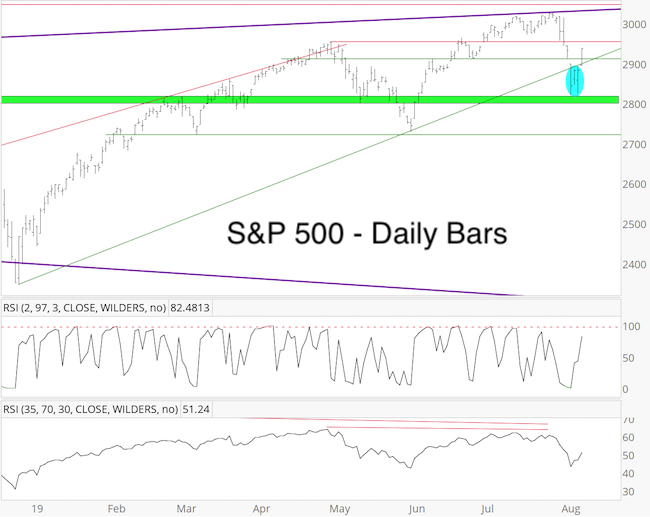
The S&P 500 is back above trend line resistance (now again support, tomorrow around 2,905). As long as trade remains above this green trend line, the rally can continue higher.
Next resistance is at 2,950 – 2,985.
Island Reversals
The term island reversal is often associated with tops but can also mark bottoms. It simple donates a number of candles at a price extreme separated by two gaps.
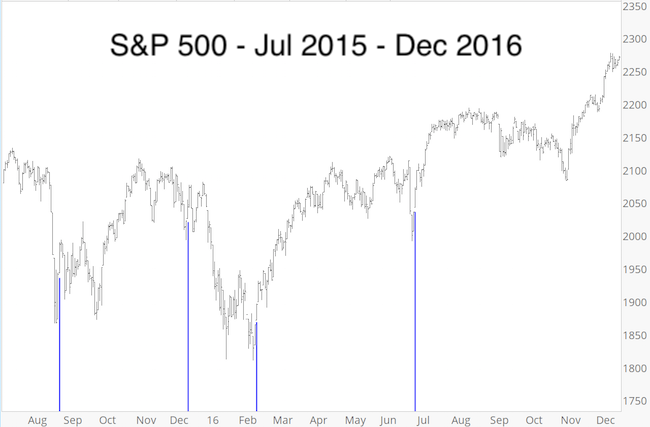
As outlined by the blue oval, the S&P 500 just staged an island reversal to the up side.
If you enjoy quality, hand-crafted research, >> Sign up for the FREE iSPYETF e-Newsletter
As indicated by the blue lines below, similar island reversals occurred in August 2,015, December 2015, February 2016 and June 2016. The short-term performance was mixed, but long-term performance was positive.
Breadth
Monday’s Profit Radar Report stated that: “Today’s drop saw 87.87% of all stocks declining. This tends to be indicative of at least short-term lows. A bounce is likely.”
The developing bounce delivered an 83.45% up day (83.45% of NYSE-traded stocks advanced) Thursday. The green lines in the chart below show that this has been positive 3 of the last 5 times it happened.
Summary
Purple trend line resistance has been validated by the S&Ps 200-point drop. It's rare for indicators to foretell are massive drop, but the evidence allows for a continuous decline.
The S&P 500 will have to stay below resistance (2,985) and fall to new lows to start validating the bearish implications of the expanding triangle pattern discussed here.
Continued updates, projections, buy/sell recommendations are available via the Profit Radar Report.
Simon Maierhofer is the founder of iSPYETF and the publisher of the Profit Radar Report. Barron's rated iSPYETF as a "trader with a good track record" (click here for Barron's evaluation of the Profit Radar Report). The Profit Radar Report presents complex market analysis (S&P 500, Dow Jones, gold, silver, euro and bonds) in an easy format. Technical analysis, sentiment indicators, seasonal patterns and common sense are all wrapped up into two or more easy-to-read weekly updates. All Profit Radar Report recommendations resulted in a 59.51% net gain in 2013, 17.59% in 2014, 24.52% in 2015, 52.26% in 2016, and 23.39% in 2017.
|