Subscribers to iSPYETF’s free e-mail newsletter receive a market outlook, usually once a week. The market outlook below was sent out on February 2, 2023. If you’d like to sign up for the free e-newsletter, you may do so here (we will never share your e-mail with anyone, just as we don't accept advertising).
What last week's Market Outlook suggested is now official. The S&P 500 broke out. The weekly chart below shows the breakout and target (open chart gap, dashed purple line).
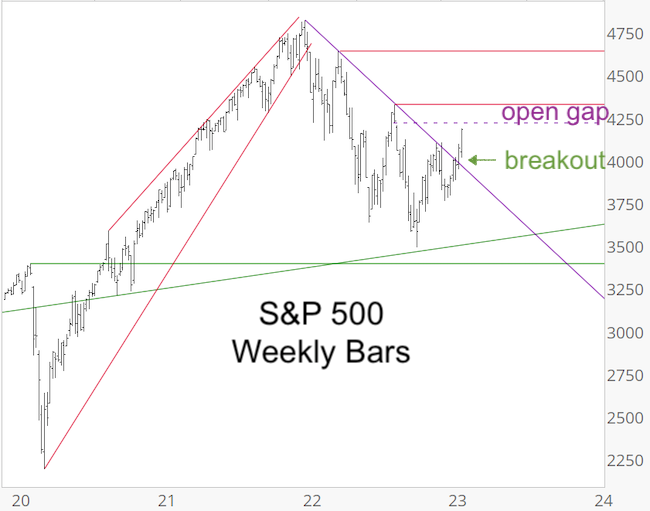
People don't give chart gaps enough credit (I love it, because little known indicators are the most effective ones).
Back in August, I wrote via the Profit Radar Report: "The S&P 500 reacted to the purple diagonal resistance and gapped lower. Regardless of how much lower the S&P goes immediately, we can almost be certain that the open gap at 4,218.70 will be closed."
Last week's free Market Outlook also stated: "Perhaps more important is the dashed purple line. It’s an open chart gap left by the 8/19/22 drop. Ever since then I’ve been talking about that chart gap being closed (most recently here: 2023 S&P 500 Forecast)."
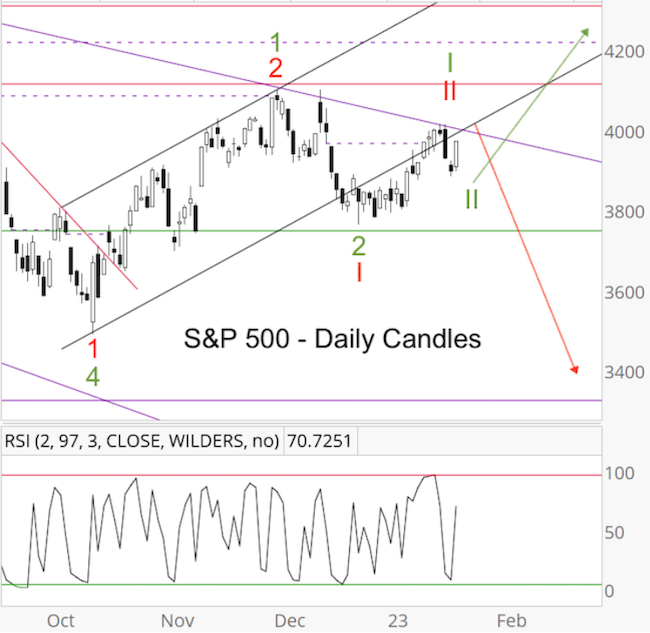
In terms of Elliott Wave Theory, the break above the purple line (which coincided with the black trend channel, see chart below) was important. Why?
The January 22 Profit Radar Report wrote that: "It looks like the wheat will be separated from the chaff rather soon (this or next week). Wheat and chaff, in this case, represents a bullish (green labels and arrow) or bearish (red labels and arrow) Elliott Wave Theory (EWT) option (see chart below). The bullish option (move above 4,016) would keep the pressure to the up side for the next weeks, perhaps longer."
I've been a big critic of Elliott Waves, because many tunnel vision analysts have solely focused on their dangerous uber-bearish EWT interpretation and mislead investors.
But in that case, EWT allowed us to pinpoint an inflection point to separate the 'wheat from the chaff' (bullish from bearish path), and it worked beautifully. EWT is a great tool if used responsibly. The next inflection zone is the open chart gap and August high (4,218 - 4,325).
2023 S&P 500 Forecast
The 2023 S&P 500 is now available! It includes 24 charts and covers the following indicators and topics:
- 2022 Review
- Supply & Demand, Breadth
- Support/Resistance Levels
- Elliott Wave Theory
- Inflation
- Socioeconomic Peace & Prosperity
- Investor Sentiment
- Seasonality & Cycles
- S&P 500 Barometers
- Valuations
- Money Flow
- Risk/Reward Heat Map
- Summary
- 2023 S&P 500 Projection
Some of the discussed indicators come with a 90% and 95% accuracy track record. All indicators and data points are combined into one forward projection (the S&P 500 is tracking it well thus far).
Below is last year's projection compared to the actual S&P 500 performance.
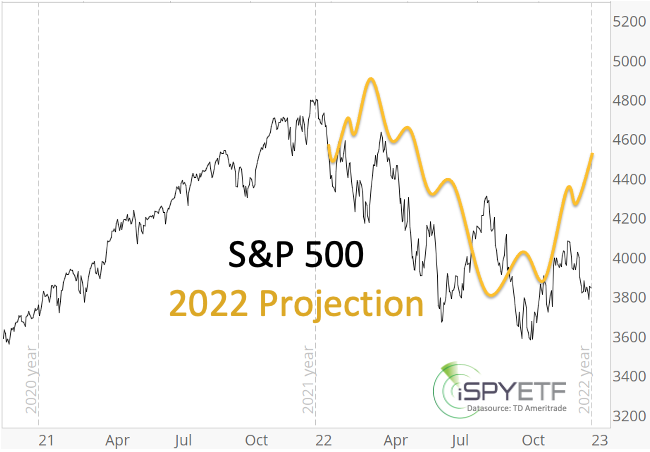
The full 2022 S&P 500 Forecast is available here for your review.
Below are some of the warning signs mentioned in the 2022 S&P 500 Forecast BEFORE the stock market fell into a pothole:
- “The bearish divergence (NY Composite a/d lines) reappeared again at the January 2022 S&P 500 highs. This internal market deterioration is a concern and a warning sign.”
- “The 6-month average of Titanic signals exceeded 25. It's been a good bear market indicator. Although the majority of breadth studies are positive, this is one that should not be ignored.”
- “We’ll focus on the commonality of all 3 (Elliott Wave Theory) scenarios: Up side is limited and down side risk is increasing.”
- "Trend line resistance is around 4,915. We do not expect the S&P to break above this trend line in 2022."
- “Short-term, the January 10, 2022 low at 4,582 is important. Failure to hold above this level would be a warning signal with the potential for a quick drop into the 4,200 - 4,300 range. If the 4,200 - 4,300 support zone fails, a test of the 4,000 zone (as low as 3,700) is possible.”
- “2022 is the mid election year, which is the weakest of the 4-year presidential election year cycle. Historically (going back to 1950), the S&P 500 declines on average about 20% into the mid-term election year low.”
- “Since the Fed is planning to unwind and reduce purchases (and shrink its balance sheet) in 2022, the risk of a more serious correction this year is much greater than in 2021.”
To receive the 2023 S&P 500 Forecast and for continued updates and purely fact based research, sign up for the
Continued updates and factual out-of-the box analysis are available via the Profit Radar Report.
The Profit Radar Report comes with a 30-day money back guarantee, but fair warning: 90% of users stay on beyond 30 days.
Barron's rates iSPYETF a "trader with a good track record," and Investor's Business Daily writes "Simon says and the market is playing along."
|
