Here is a look at an indicator that has the distinct reputation of signaling the 2000 and 2007 meltdowns – the XLY: XLP ratio.
XLY (Consumer Discretionary Select Sector SPDR) represents a dynamic and economically sensitive sector of the S&P 500.
XLP (Consumer Staples Select Sector SPDR) represents a stable, boring and supposedly recession proof sector of the S&P 500.
The XLY:XLP ratio shows which sector investors prefer, and as such serves as a historically accurate risk on/risk off indicator.
The first chart plots the S&P 500 against the XLY:XLP ratio (I’ll call it XXR from here on). The green lines show that XXR respects trend line support.
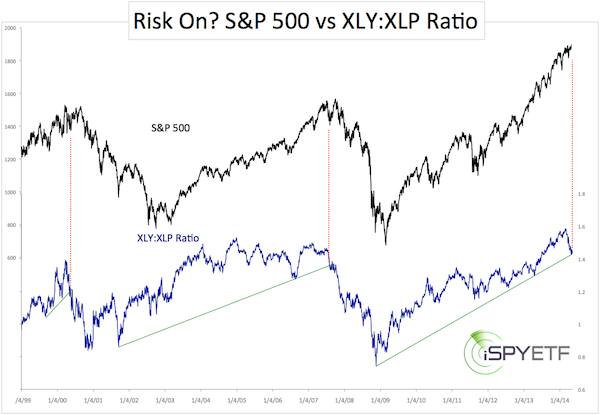
In fact, a break below this trend line support in 2000 and 2007 is what foreshadowed trouble for the S&P 500 (SNP: ^GSPC).
This week, the XXR is exactly at trend line support once again. Extrapolating the past into the future would suggest another meltdown (assuming XXR will go on to drop below support).
However, there are some differences.
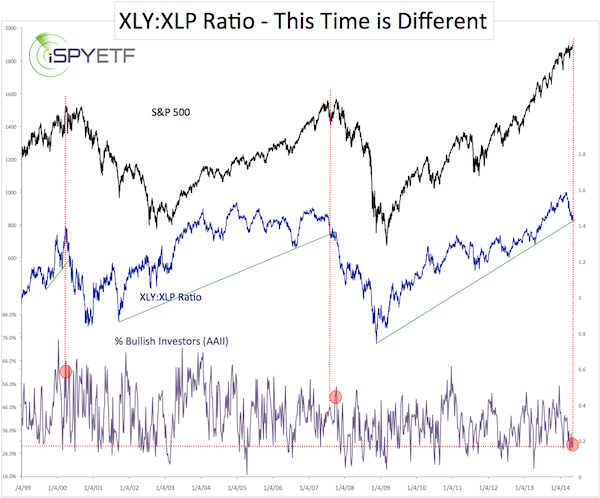
The second chart adds the percentage of bullish investors polled by AAII into the equation.
For the past several weeks the Profit Radar Report has been pointing out that retail investors along with the media (or investors influenced by the media) have turned quite bearish.
For example, when the S&P traded around 1,860 on May 7, the Profit Radar Report stated that: “The weight of evidence suggests the onset of a larger correction in May, but we are not the only ones expecting a correction. A false pop to 1,900 – 1,915 would shake out the weak bears.”
Last week’s spike to 1,902 may have been this ‘false pop.’
Is Today’s Environment the Same as in 2000 and 2007?
I’ve added the % of AAII bulls to show that today’s environment differs from what we saw in 2000 and 2007.
In 2000 and 2007 most market participants were bullish. Today they are not.
It should also be noted that XXR’s 2007 break below trend line support came a few weeks too early and could have resulted in some annoying short-term losses as the S&P 500 (NYSEArca: SPY) staged its final rally leg.
Summary
The XLY:XLP Ratio has done a decent job foreshadowing the 2000 and 2007 crashes, but the overall environment suggests that this time is different.
There is not enough fuel (aka bullish investors) to drive the S&P 500 down substantially (more than 20%) and keep it down.
As mentioned above though, in the 2014 S&P 500 Forecast (published on January 15 via the Profit Radar Report), I projected a correction in May or June. This forecast remains valid.
Here is the key must hold short-term S&P 500 level that - once broken - would trigger further selling along with key short-term resistance:
Short-term S&P 500 Analysis
Simon Maierhofer is the publisher of the Profit Radar Report. The Profit Radar Report presents complex market analysis (S&P 500, Dow Jones, gold, silver, euro and bonds) in an easy format. Technical analysis, sentiment indicators, seasonal patterns and common sense are all wrapped up into two or more easy-to-read weekly updates. All Profit Radar Report recommendations resulted in a 59.51% net gain in 2013.
Follow Simon on Twitter @ iSPYETF or sign up for the FREE iSPYETF Newsletter to get actionable ETF trade ideas delivered for free.

|
