Subscribers to iSPYETF’s free e-mail newsletter receive a market outlook, usually once a week. The market outlook below was sent out on December 16, 2021. If you’d like to sign up for the free e-newsletter, you may do so here (we will never share your e-mail with anyone, just as we don't accept advertising).
Last week's free Market Outlook pointed out resistance around 4,700, which is where the S&P 500 closed on Friday.
Sunday's Profit Radar Report featured a projection, which illustrated what was most likely to happen.
Shown below is the original projection (left side) along with an updated price chart (right side).
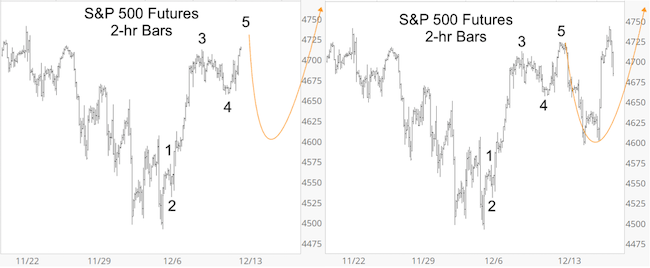
The S&P was rejected by resistance around 4,700, found support around 4,600 and made it back up to 4,700+/-.
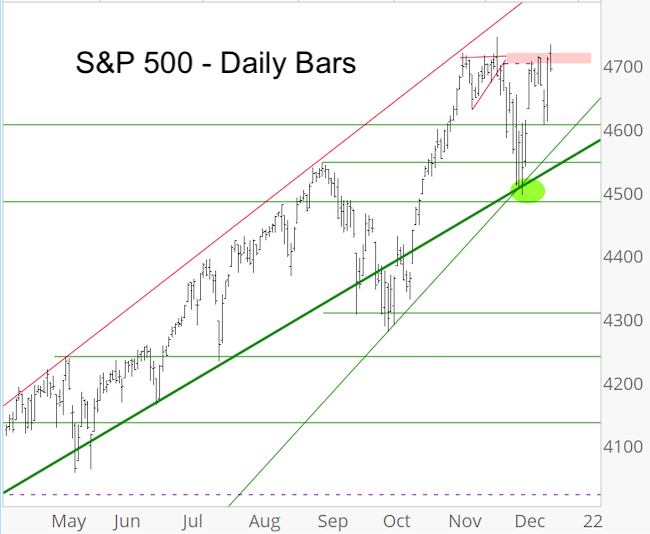
As mentioned last week, I still believe 4,700 should be exceeded eventually, but for now it remains resistance. The daily S&P 500 chart below shows why.
Some have said that a VIX around 20 with the S&P 500 at or within striking distance of an all-time high is dangerous for stocks. Statistically, that's only half true.
The chart below highlight every time the S&P was within 0.5% of an all-time high when the VIX was above 19.
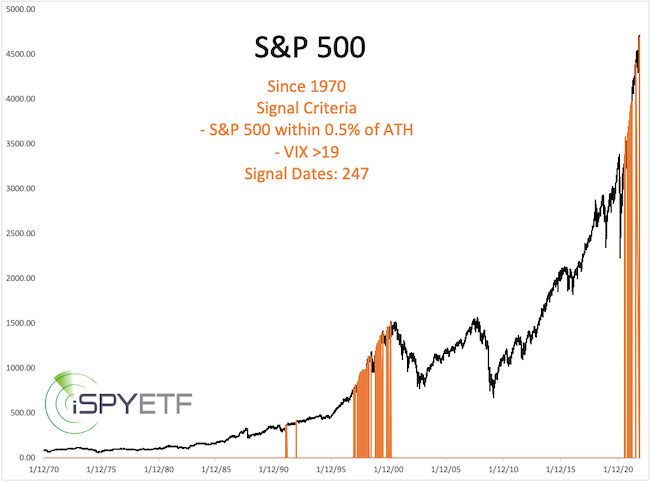
We get 247 signals spread out over two distinct time periods. There was an eventual reckoning in 2000, but 'eventually' meant years later. The warning for premature bears is that markets can remain irrational longer than investors stay solvent.
Another cliche kind of opinion I've read repeatedly lately is that the market is closer to a top than a bottom. What's an investor to do with a 'forecast' like that. Go short with a stop-loss at the March 2020 low? Duh, after a 100% rally it's probably safe to say that the bottom is further away than some sort of top.
I don't always know what the market is going to do next, but one thing subscribers to the Profit Radar Report always get is factual, objective information, not cliches and personal opinions.
Talking about factual, as you know, I study many historic patterns, and one recent study absolutely stood out. This pattern, seen during the last couple weeks, occurred 8 other times since 1970 and was followed by the same outcome every time.
Not only was the outcome consistently the same, it was also in the double digits. It is incredibly rare to find such a persuasive pattern.
The exact pattern, whether bullish or bearish, and when it happened before is featured in the December 8, 2021 Profit Radar Report. Don't invest blindly, get the radar.
Continued updates, out-of-the box analysis and forward performance based on historic precedents (Risk/Reward Heat Map) are available via the Profit Radar Report.
The Profit Radar Report comes with a 30-day money back guarantee, but fair warning: 90% of users stay on beyond 30 days.
Barron's rates iSPYETF a "trader with a good track record," and Investor's Business Daily writes "Simon says and the market is playing along."
|
