Apple is within striking distance of its 2012 all-time high (100.72, split adjusted) and iWatch rumors are stoking investors’ imagination.
Is Apple (Nasdaq: AAPL) a buy?
Here are 3 reasons why Apple should move higher and one reason why not.
Time to Buy: Apple is Cheap
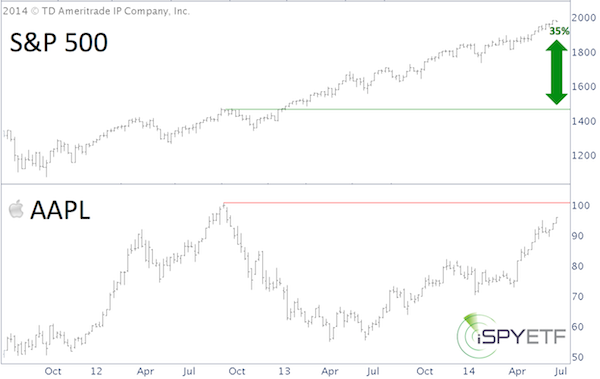
Compared to the S&P 500, AAPL is cheap. AAPL is still trading 4% below its September 2012 all-time high.
The S&P 500 (SNP: ^GSPC) is 35% higher today than it was in September 2012 (see S&P 500 / AAPL chart below).
Apple’s P/E (based on forward earnings) is only 13, compared to 15 for the S&P 500.
Time to Buy: Apple’s Got its Mojo Back
After an 18-month, 45% bear market, Apple is catching more positive spotlight (again). Investors and the media are excited about the anticipated release of the iWatch and iPhone 6.
Time to Wait: Overhead Resistance Could Stifle Rally
The all-time high around $100 is an obvious hurdle. Trying to run through a hurdle can be painful. It may make sense to wait until the hurdle is overcome and then use it as a stop-loss level.
Time to Sell: Apple is Hot, too Hot for its own Good
The Apple buy signal is not a hidden secret. Here are just a few headlines from Monday:
-
CNBC: “This chart says Apple’s setting up for a huge move higher”
-
Nasdaq: “Why investors should own Apple now”
-
TheStreet.com: “Why Apple Stock remains a ‘buy’ at the Street”
The last time the media took a bold stand was in May, when it persistently proclaimed a market crash or correction (view a fascinating tale of recent ‘media bloopers’ here).
Time to (almost) Buy: Seasonality
The Profit Radar Report produces hand-crafted seasonality charts for many major indexes. An Apple seasonality chart was made available in 2012, since AAPL accounted for over 20% of the Nasdaq 100 (Nasdaq: QQQ) and over 5% of the S&P 500 (NYSEArca: SPY).
The seasonality chart projected a seasonal high on September 16. AAPL’s all-time high at 705 (pre-split) occurred on September 22.
The seasonality chart also projected a seasonal low in mid-April.
A complimentary look at the full Apple seasonality chart and what’s next for Apple is available here:
AAPL Seasonality Chart
Simon Maierhofer is the publisher of the Profit Radar Report. The Profit Radar Report presents complex market analysis (S&P 500, Dow Jones, gold, silver, euro and bonds) in an easy format. Technical analysis, sentiment indicators, seasonal patterns and common sense are all wrapped up into two or more easy-to-read weekly updates. All Profit Radar Report recommendations resulted in a 59.51% net gain in 2013.
Follow Simon on Twitter @ iSPYETF or sign up for the FREE iSPYETF Newsletter to get actionable ETF trade ideas delivered for free.

|
