Up until now, iSPYETF did not participate in the Brexit discussion. Why? Until the votes are cast and counted, it’s all speculation. We can’t predict the outcome of the vote and how the market reacts.
The best thing we can do is look at our dashboard of indicators and decipher their message. Based on our indicators, the Profit Radar Report anticipated a pullback in early June, but stated on June 15 that: "Following five consecutive down days, the S&P is compressed and prone to bounce. Based on Elliott Wave Theory, this bounce should stop at 2,090 – 2,110."
Barron's rates iSPYETF as a "trader with a good track record." Click here for Barron's assessment of the Profit Radar Report.
We are right at 2,110, just a few hours before Britain heads to the polls.
As the vote is imminent, there are three absolute must know facts:
-
Timing
-
Bullish/Bearish VIX Pattern
-
S&P 500 Coiling Pattern
1) Timing
According to the BBC, polls will close on Thursday at 22:00 GMT (3:00pm PST, 6:00pm EST). The ballot count is expected to start as soon as the polling stations close. Credit Suisse estimates that about 25% of the votes will be counted by 3:00am GMT (8:00pm PST, 11:00pm EST), 50% of the votes will be counted by 4:00am GMT (9:00pm PST, 12:00am EST).
There will be a rolling total so the time at which one side reaches the point of being mathematically unbeatable depends on how quickly the vote are counted and how close the results are running. Some expect the final result on Friday around 7:00am GMT (12:00am PST, 3:00am EST).
In other words, Wall Street will likely be closed when the results come in. This may well result in a gap up or gap down open on Friday morning. Risk adverse investors who don't want any voting-related risk, should close out positions before the end of close today.
2) Bullish/Bearish VIX Pattern
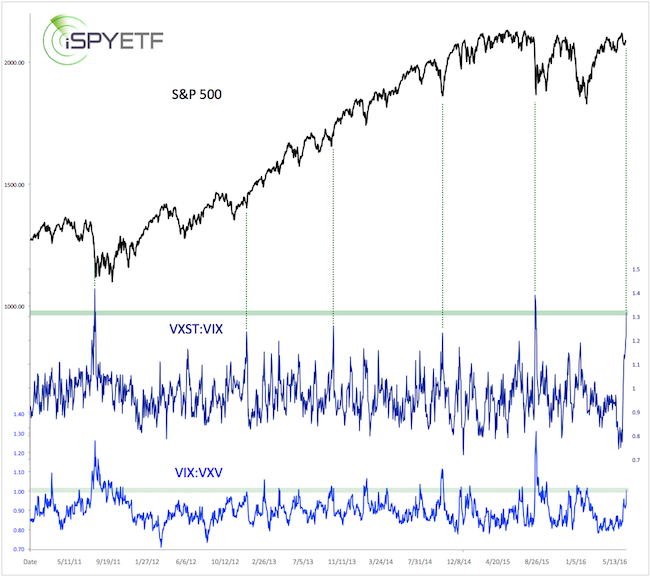
There are three different volatility indexes:
-
CBOE Short-term Volatility Index (VXST): Expectations of 9-day volatility
-
CBOE Volatility Index (VIX): Expectation of 30-day future volatility
-
CBOE 3-Month Volatility Index (VXV): Expectation of 3-month volatility
Looking at the volatility correlation between various time frames can provide helpful clues.
For example, the expectation of increased short-term volatility relative to long-term volatility (VIX/VXV ratio above 1, or VXST/VIX ratio above 1.2) is usually a contrarian indicator. When investors brace themselves for more immediate volatility, the opposite tends to happen and stocks move higher. Investors are bracing themselves right now.
If you enjoy quality, hand-crafted research, >> Sign up for the FREE iSPYETF Newsletter
The first chart plots the S&P 500 against the VXST/VIX and VIX/VXV ratio. Short-term volatility is elevated relative to longer-term volatility.
The VXST/VIX ratio is at 1.31. The dashed green lines show that similar readings in the past coincided with market lows. The VIX/VXV ratio is at 1, which is elevated as well.
However, VIX seasonality is nearing the best buy signal of the year.
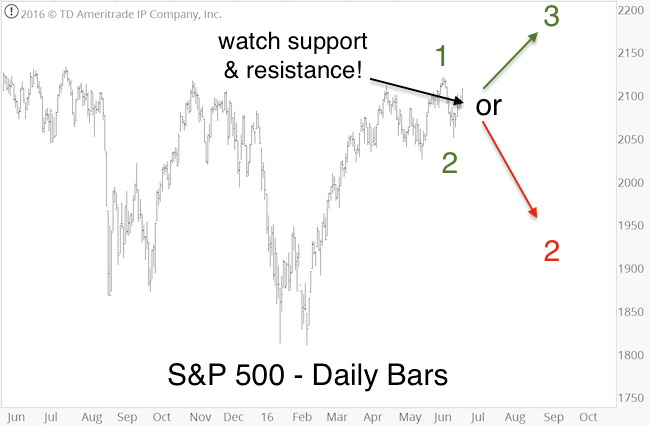
S&P 500 Coiling Pattern
Based on Elliott Wave Theory, the S&P 500 is at or near a significant inflection point (fork in the road).
Summary
According to the charts, stocks are at or near an important inflection point, and the Brexit vote may be the catalyst for the next move.
The market could break into either direction. Now is the time to watch important support/resistance levels. Trade above resistance is likely to send stocks significantly higher, while a drop below support should lead to a sizeable correction.
Continued S&P 500 analysis is available via the Profit Radar Report.
Simon Maierhofer is the founder of iSPYETF and the publisher of the Profit Radar Report. Barron's rated iSPYETF as a "trader with a good track record" (click here for Barron's profile of the Profit Radar Report). The Profit Radar Report presents complex market analysis (S&P 500, Dow Jones, gold, silver, euro and bonds) in an easy format. Technical analysis, sentiment indicators, seasonal patterns and common sense are all wrapped up into two or more easy-to-read weekly updates. All Profit Radar Report recommendations resulted in a 59.51% net gain in 2013, 17.59% in 2014, and 24.52% in 2015.
Follow Simon on Twitter @ iSPYETF or sign up for the FREE iSPYETF Newsletter to get actionable ETF trade ideas delivered for free.

If you enjoy quality, hand-crafted research, >> Sign up for the FREE iSPYETF Newsletter
|
