Subscribers to iSPYETF’s free e-mail newsletter receive a market outlook, usually once a week. The market outlook below was sent out on January 4, 2024. If you’d like to sign up for the free e-newsletter, you may do so here (we will never share your e-mail with anyone, just as we don't accept advertising).
Today's free Market Outlook contains some charts and forecasts previously only shared with subscribers. Hope you will find them helpful in navigating 2024.
As regular readers know, the Profit Radar Report always provides objective and comprehensive analysis and sums up all that information with a simple, bottom line summary.
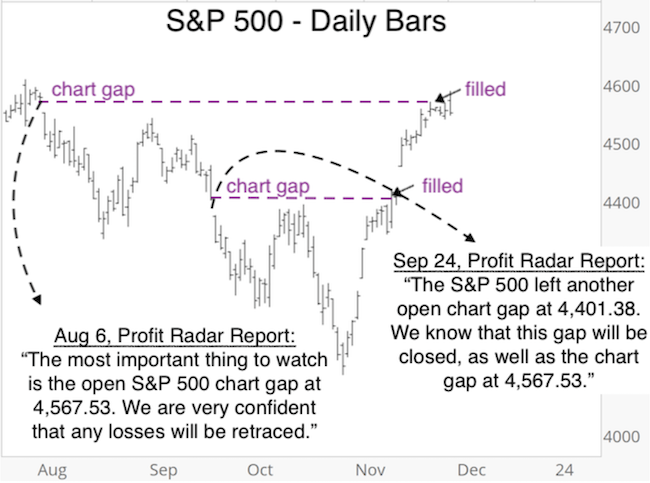
The bottom line for much of H2 2023 was this observation, first published in the August 6 Profit Radar Report (and many times thereafter):
“The most important thing to watch, at this point, is the open S&P 500 chart gap at 4,567.53. As long as it remains open (and we hope it does), we are very confident that any losses (and we hope we’ll see more) will be retraced and there will be an eventual buying opportunity.”
As the chart below shows (you may remember it from the last free Market Outlook), the S&P 500 rallied impressively (and unexpectedly for most) to fill the charts.
Closing the gaps eliminated the ‘up side guarantee.’ Now what?
Here is what the November 19, 2023 Profit Radar Report stated:
“One of the most trusted (although least know) ‘indicators’ have been chart gaps. And once again it appears like our trust in chart gaps getting filled was well-placed. At this point, the open S&P 500 chart gap is only 53.51 points away. I won’t take much to remove this indicator and the implied 'up side guarantee.’ If the gap gets closed, we hope a new one will open if and before the market decides to decline.
Based on the historic track record, the Zweig Breadth Thrust (ZBT) - discussed in the November 8 and 11 PRRs - deserves a fair amount of trust as well. In terms of up side target, the ZBT is not nearly as specific as open chart gaps, but it tells us that the odds strongly favor rising stocks. Based on the post-ZBT price trajectory, this overall bullish outlook deserves our trust as long as the S&P 500 does not close below 4,100.”
Why does the Zweig Breadth Thrust deserve our trust?
The November 8, 2023 Profit Radar Report explained:
“I read the following today: 'The Dow and S&P indexes closed higher both Monday and Tuesday attended by negative breadth, usually a strong sign that an advance is terminal.' This haphazard blanket statement is void of facts, like concluding someone has cancer because they are in pain. Not surprising this is coming from a permabear outfit that’s ignoring last week’s strong breadth performance.
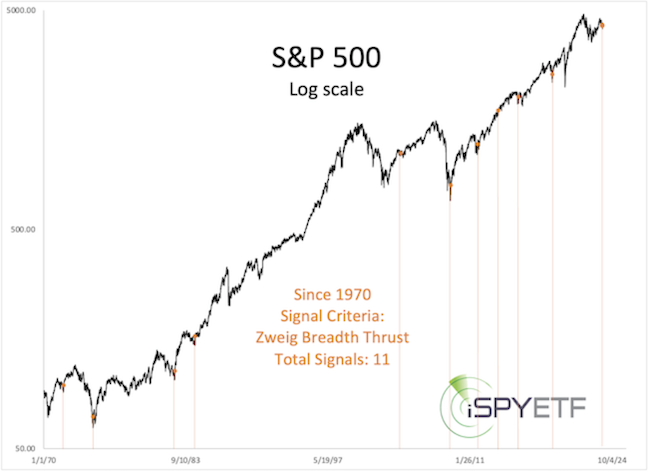
In fact, last week’s surge triggered a Zweig Breadth Thrust (ZBT) for the fist time since 2019. There are different kind of ‘thrusts,’ but the ZBT is rules-based and therefore well respected. Since 1970, the ZBT (first time in a year) triggered only 10 other times.
The chart below highlights those 10 other times.
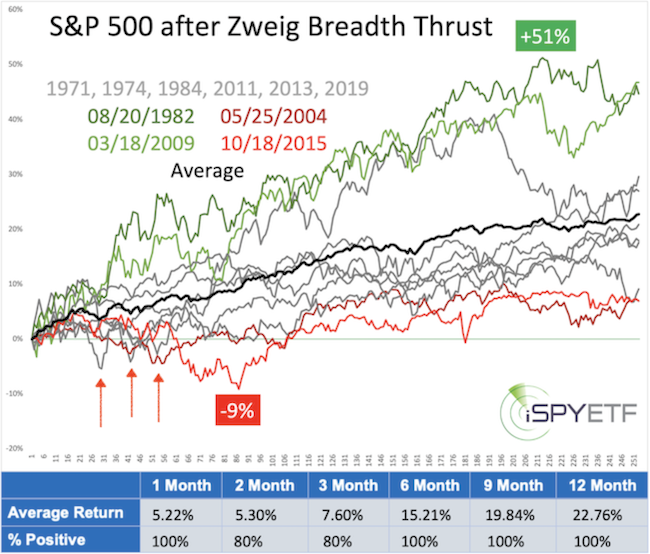
The next chart shows the S&P 500 forward performance following the last 10 signals. As far as signal consistency is concerned, that’s about as good as it gets. Shown in green are the two most bullish signals, in red are the two most bearish signals. The remaining signals are in gray. Not all of the signals delivered blockbuster returns, but all of them showed gains after 6, 9, 12 months.
What about this week’s soft breadth numbers? Statistically, stocks are prone to take a breather immediately following a breadth thrust, so a pullback is in line with historic performance. As the above chart shows, the worst reactions following a signal showed 5%, 4%, 4% losses within the first 3 months (and 9% 4 months later). A drop below 4,140 (5% loss from Friday’s close) within the next few months would be a departure from previous post signal trajectories and perhaps an early indication that the ZBT may not work as usual.”
The Profit Radar Report’s Risk/Reward Heat Map (RRHM) is fed by the projected forward returns of dozen’s of studies like the one above. The RRHM weight of evidence forecast harmonized with the Zweig Breadth Thrust study, which is why the November 19, 2023 PRR outlined this simple, bottom line approach going forward:
“The odds strongly favor rising stocks. Based on the post-ZBT price trajectory, this overall bullish outlook deserves our trust as long as the S&P 500 does not close below 4,100.”
The positive breadth thrust implication are reduced (likely short-term) by extreme investor sentiment readings. Therefore the sluggish start into 2024 is no surprise. It’s actually healthy and I would be thrilled to see further losses. Why? Because new chart gaps have opened up, virtually guaranteeing a recovery.
At no point did the S&P even get close to 4,100 and rallied stronger than even I - one of the last remaining bulls - anticipated.
The full 2024 S&P 500 Forecast will be published soon. Before you take the plunge and subscribe to the Profit Radar Report, take a look at last year’s 2023 S&P 500 Forecast (now available for the first time for free) and compare how it compares to reality. I think you’ll be impressed.
Once you see for yourself, feel free to take the Profit Radar Report for a test drive and become the best informed investor you know.
The Profit Radar Report comes with a 30-day money back guarantee, but fair warning: 90% of users stay on beyond 30 days.
Barron's rates iSPYETF a "trader with a good track record," and Investor's Business Daily writes "Simon says and the market is playing along."
|
