Subscribers to iSPYETF’s free e-mail newsletter receive a market outlook, usually once a week. The market outlook below was sent out on January 12, 2023. If you’d like to sign up for the free e-newsletter, you may do so here (we will never share your e-mail with anyone, just as we don't accept advertising).
I'd like to ask you to participate in a brief mental exercise as you read these lines:
How often have you read or heard the words or phrases recession, economic contraction, stock market crash, inflation is bad for stocks, etc. in the last few weeks? Ok, think about it for just a moment ...
Now, did stocks perform as you thought based on the news you heard?
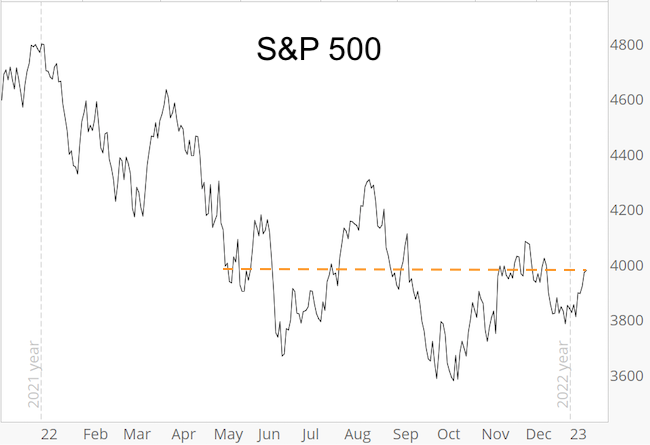
The simple chart shows that the S&P 500 today is trading exactly where it was on May 9, 2022. Nine months with progress (or crash).
We live in a world where boring doesn't sell, and the media wants to capture your eyeballs at all cost. The most effective way to do that is with sensationalistic headlines. Truth and analytic integrity are at best secondary considerations.
Unnecessary sensationalistic stock market analysis irks me to the core. That's why my Profit Radar Report is different. You read what I see, and I haven't had to stray from the BORING assessment shared in the November 13 Profit Radar Report, which was:
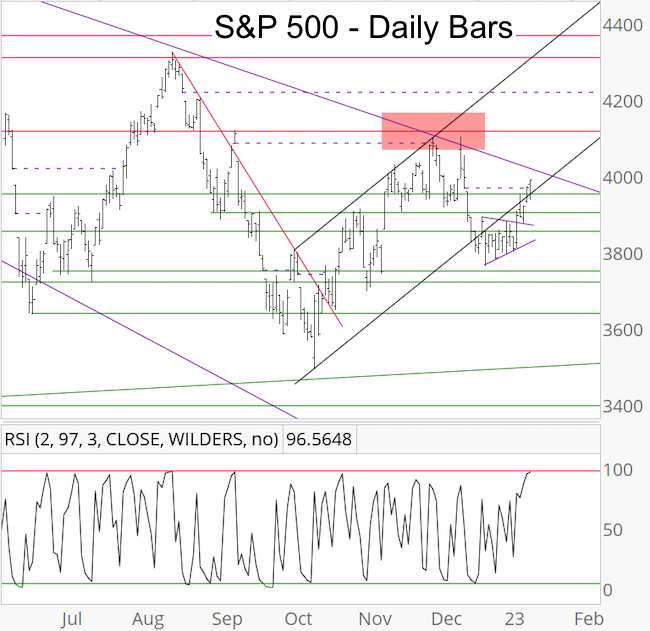
"Chart gaps at 4,083.67 and 4,218.70 remain open. The next serious resistance zone is around 4,100. Short-term support is around 3,900. A pullback can happen any moment and price action may well be choppy in coming days/weeks, but odds of further gains following pullbacks are good."
You may recall that I added the following in my last free Market Outlook (from December 16, 2022):
"I'd like to point out that support around 3,900 has become quite obvious, which makes a seesaw across it more likely, and today's drop created another chart gap at 3,965.65 which should be closed in the not so distant future."
As anticipated, the S&P seesawed across 3,900 (multiple times), moved back above it, and closed the open chart gat at 3,965.65 (dashed purple line) yesterday.
A word of caution: The fledgling 2023 rally has pushed the S&P 500 into the next resistance cluster. I consider this an inflection zone that needs to be watched carefully.
2023 S&P 500 Forecast
This is the time of year where I'm working on the full year S&P 500 Forecast. This forecast includes the most pertinent facts and indicators and an actual price projection based on those indicators.
The proof is in the pudding and the chart below plots my 2022 S&P 500 projection (yellow line) against the actual price action (you can see the original projection at the bottom of this page).
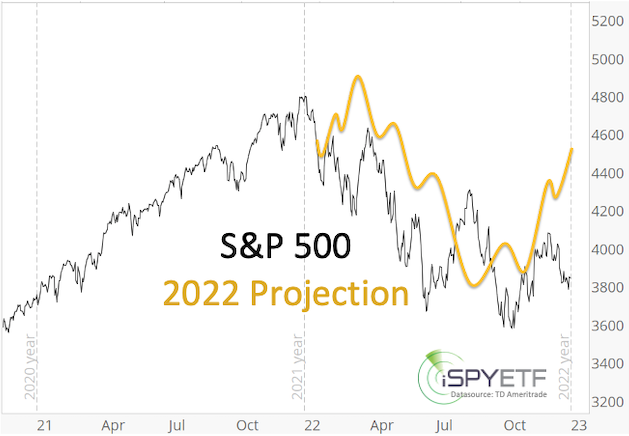
The full S&P 500 Forecast is available here for your review.
Below are some of the warning signs mentioned in the 2022 S&P 500 Forecast BEFORE the stock market fell into a pothole:
- “The bearish divergence (NY Composite a/d lines) reappeared again at the January 2022 S&P 500 highs. This internal market
deterioration is a concern and a warning sign.”
- “The 6-month average of Titanic signals exceeded 25. It's been a good bear market indicator. Although the majority of breadth studies are positive, this is one that should not be ignored.”
- “We’ll focus on the commonality of all 3 (Elliott Wave Theory) scenarios: Up side is limited and down side risk is increasing.”
- "Trend line resistance is around 4,915. We do not expect the S&P to break above this trend line in 2022."
- “Short-term, the January 10, 2022 low at 4,582 is important. Failure to hold above this level would be a warning signal with the potential for a quick drop into the 4,200 - 4,300 range. If the 4,200 - 4,300 support zone fails, a test of the 4,000 zone (as low as 3,700) is possible.”
- “2022 is the mid election year, which is the weakest of the 4-year presidential election year cycle. Historically (going back to 1950), the S&P 500 declines on average about 20% into the mid-term election year low.”
- “Since the Fed is planning to unwind and reduce purchases (and shrink its balance sheet) in 2022, the risk of a more serious correction this year is much greater than in 2021.”
To receive the 2023 S&P 500 Forecast and for continued updates and purely fact based research, sign up for the Profit Radar Report and become the best informed investor you know.
The Profit Radar Report comes with a 30-day money back guarantee, but fair warning: 90% of users stay on beyond 30 days.
Barron's rates iSPYETF a "trader with a good track record," and Investor's Business Daily writes "Simon says and the market is playing along."
|
