Subscribers to iSPYETF’s free e-mail newsletter receive a market outlook, usually once a week. The market outlook below was sent out on May 15, 2025. If you’d like to sign up for the free e-newsletter, you may do so here (we will never share your e-mail with anyone, just as we don't accept advertising).
The S&P 500 has come within 4% of its all-time high and more than erased all of the March/April’s losses. By doing so, the market has once again ousted the media’s foolish herding mentality. To wit:
4/4/2025
- Reuters: Shell-shocked markets brace for more tariff tumult
- CNBC: Cramer says Trump is following the perfect plan if the goal is to crash the market
- Bloomberg: Trump’s tariffs to send US into recession in 2025
4/7/25
- AP, CBS News: Wall Street could be headed for a bear market
4/8/2025
- Portfolio Advisor: Recession fears grow as the S&P 500 slips into bear market territory
4/9/25
- Bloomberg: We are still heading into a bear market
- Barrons: The S&P 500 is on track to enter a bear market
4/10/25:
- ThinkAdvisor: Feels like a ‘classic bear market’
4/11/25
- CNBC: These violent market swings feel like bear market behavior, traders say
In contrast to the overdone fear, the special April 6 (1 day before the low) edition of the Profit Radar Report stated:
“The odds of a S&P 500 low occurring tomorrow or Tuesday are considerable. Any low (and subsequent bounce) may still be followed by a retest or another low within the next few days/weeks, but the market is stretched enough for a sizable bounce.
Even if a bounce doesn’t occur right away, the open chart gaps (5,390.83 & 5,571.48) strongly suggest that any additional losses will be erased. Prices are depressed enough to put some (not all) cash to work. Depending on your risk tolerance, you may choose to deploy 1/3, 1/4, 1/5 or other portion of your available cash.”
The actual low occurred on the next day, Monday (4,835.04 for the S&P 500).
Since then, the S&P has rallied to close the open chart gaps at 5,390.83 and 5,571.48. I referenced those two chart gaps in the Free Special S&P 500 Selloff Report (published on April 4), which stated:
“The S&P 500 is virtually guaranteed to (eventually) rally and erase all of today’s, most of yesterday's, and any losses we may see in the coming days.
There are also some technical aspects starting to suggest a bounce.
This is a bold statement, but it's based on a little known trade secret with a 100% track record of accuracy over the past 25+ years.”
The 100% track record of my favorite indicator remains in tact.
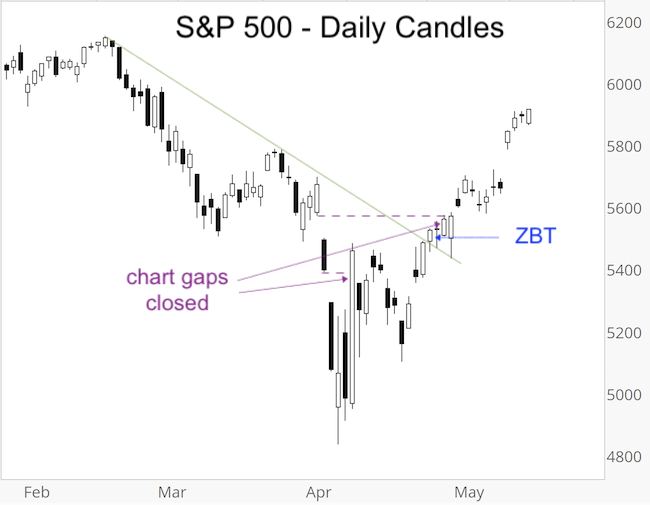
What about the risk of a retest of the lows (mentioned in the April 6 Profit Radar Report)?
It’s still possible, but has become much less likely. Why? The rally from the April 7 low triggered a lot of positive studies, including the Zweig Breadth Thrust (ZBT).
Below is a brief excerpt from the April 27 Profit Radar Report explaining the ZBT and its implications:
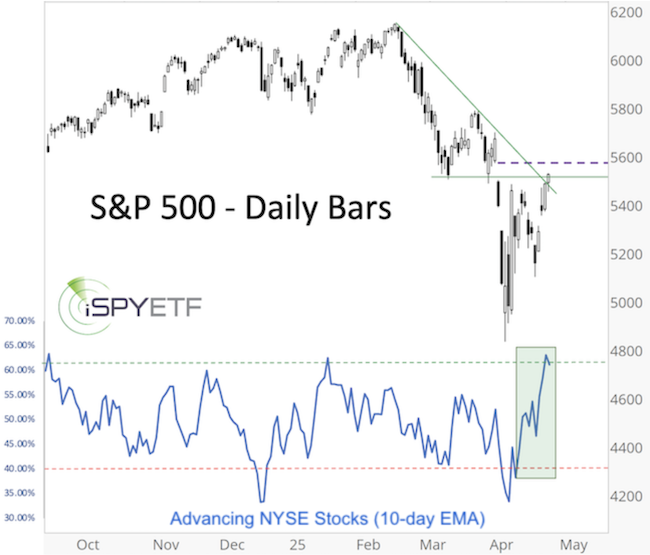
"At yesterday’s close, there was a Zweig Breadth Thrust (ZBT) based on NYSE-traded stocks. Long-term subscribers will remember the bullish implications of ZBT, previously discussed in the November 8, 2023 PRR and 2024 S&P 500 Forecast.
The ZBT is the gold standard of breadth thrusts and happens when the 10-day EMA (exponential moving average) of advancing stocks cycles from <40% to >61.5% within 10 days or less.
The chart below plots the S&P 500 against the 10-day EMA of NYSE-traded advancing stocks.
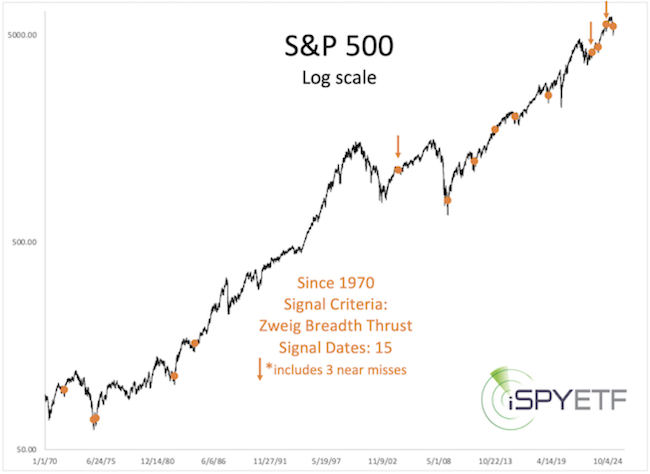
Since 1970, there have been 11 other signals that met the ZBT criteria and 3 additional signals that came very close. The reason for including ‘almost ZBTs’ is that advance/decline data varies somewhat depending on the data source. The data of one provider may trigger a ZBT while another might not.
The chart below shows all signals, including the 3 ‘almost ZBTs’ (marked with an orange arrow).
#STUDY: Shown next is the S&P 500 performance after each signal. The green graphs are ZBT signals that met all requirements, orange graphs represent ‘almost ZBTs.’ The bright orange graph represents the 8/19/2024 signal, which also shows the worst performance of any ZBT.
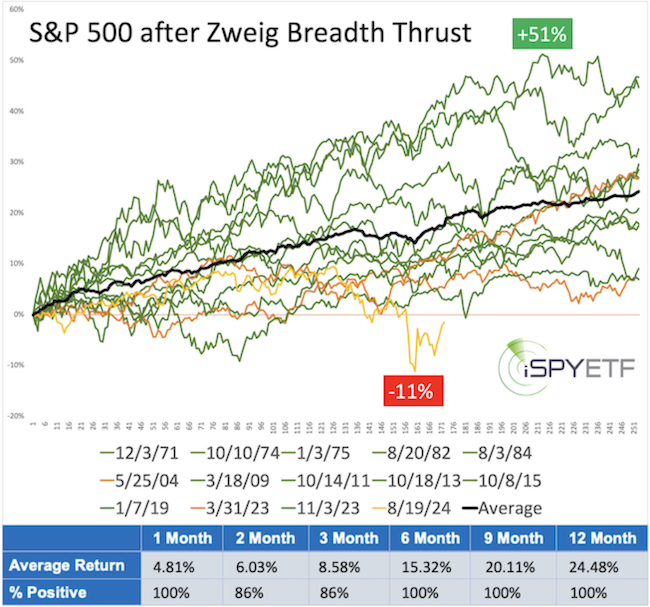
Nevertheless, the win ratio of the ZBT is perfect, with the S&P 500 up every time 1, 6, 9, and 12 month after the signal and maximum losses never to exceed 10% at any time (aside from the 8/19/2024 signal).
In addition to the ZBT, the S&P 500 had 3 consecutive daily gains of 1.5% or more. This happened only 9 other times since 1970. 1 month later, the S&P was up 67% of the time, 3 month later 77%, 6 months later 91%, and 1 year later, the S&P was up every time.
On Tuesday, every single Nasdaq-100 component ended the day in the green, which happened 7 other times since 2003. 1 month later, the Nasdaq-100 was up 57% of the time, 3 month later 71%, 6 and 12 months later 100%.
What about price pattern correlation? Highlighted below are the periods with the S&P 500 price patterns most highly correlated to that of the past year.
Here is a more direct comparison of the most recent 1-year performance with the periods highlighted above. 3/16/2021 - 3/14/2022 (purple graph) shows the highest correlation in recent years.
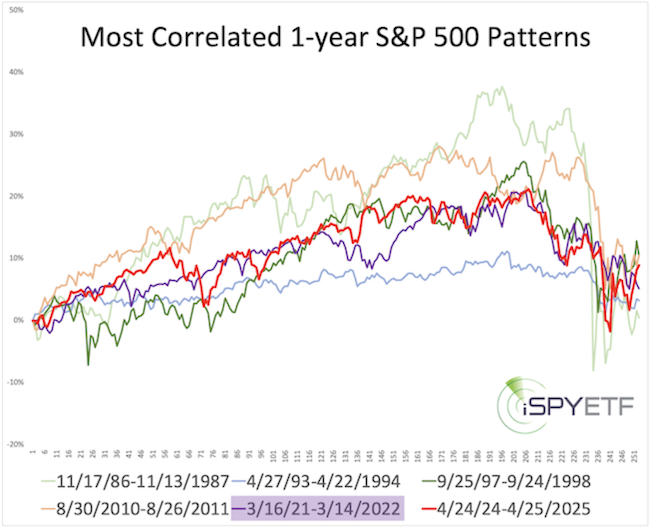
#STUDY: Next up is how the S&P 500 fared after the most correlated past 1-year periods.”
To view the S&P 500 performance following the most correlated price patterns, sign up for the Profit Radar Report.
Summary: Based on the most recent studies, the S&P 500 is performing as expected. The question now (and for the past couple of weeks) is: Should you chase price?
Right now, the S&P 500 is over-bought and pullbacks will likely be bought. A close below 5,750 could be an indication of a deeper decline.
Become the best informed investor you know, subscribe to the Profit Radar Report and get access to 100% objective and fact based analysis. Continued updates and factual out-of-the box analysis are available via the Profit Radar Report.
The Profit Radar Report comes with a 30-day money back guarantee, but fair warning: 90% of users stay on beyond 30 days.
Barron's rates iSPYETF a "trader with a good track record," and Investor's Business Daily writes "Simon says and the market is playing along."
|
