Subscribers to iSPYETF’s free e-mail newsletter receive a market outlook, usually once a week. The market outlook below was sent out on October 8, 2026. If you’d like to sign up for the free e-newsletter, you may do so here (we will never share your e-mail with anyone, just as we don't accept advertising).
Somebody very powerful, now serving his second term (you probably know who), has been campaigning for lower interest rates (ideally 1%). Why? Because high rates kill stocks.
He is not the only one convinced that rising rates sink stocks. This MarketWatch headline reflects what the financial media, analysts and many investors fear:
“As Treasury yields touch generational highs, investors brace for the market fallout”
Instead of blindly believing, let’s examine a few common sense facts:
Common sense … is not so common
10-year Treasury yields have soared from 0.52% on August 4, 2020 to 5.31% on October 5, 2026 - that’s a gain of 921%. Over the same period, the S&P 500 rallied 136.5% (from 3,306 to 7,818).
This fact alone shows that - at least since 2020 - rising rates have not been bearish for stocks. In fact, the opposite has been true.
Digging deeper
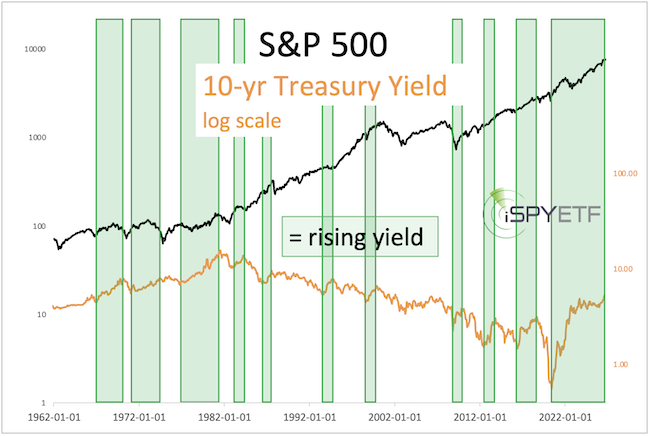
The chart below plots the 10-year Treasury yield against the S&P 500. The yield chart is based on a logarithmic scale to properly express the scope of the rally from the 2020 low.
Here are important points to keep in mind:
- Yields were in a bear market from 1980 - 2020. There has never been a yield rally as strong as the latest one.
- The green boxes highlight periods of rising yields. Rising yields have only occasionally sunk stocks.
- Yields were rising during most of President Trump’s first term … and so did stocks (second green box from the right).
Fool me once … fool me twice …
The media’s (gloom-and-doom) fascination with rising yields reminds me of early 2021, when 10-year Treasury yields just soared 175%. Here are some headlines from February 2021:
- 2/18/21: Rising rates are hurting stocks. The threat isn’t going away. - Barron’s
- 2/19/21: Surging US Treasury yields threaten stock market rally - S&P Global
- 2/24/21: The stock market is falling because Treasury yields won’t stop rising - Barron’s
- 2/25/21: Why stock investors are starting to really worry about rising bond yields - CNBC
- 3/2/21: The Treasury market is spooking tech stocks again. Here’s why. - Barron’s
At that time, I wrote a special report for Profit Radar Report subscribers. Below is an excerpt from this report (published on March 10, 2021):
Continued updates and factual out-of-the box analysis are available via the Profit Radar Report.
The Profit Radar Report comes with a 30-day money back guarantee, but fair warning: 90% of users stay on beyond 30 days.
Barron's rates iSPYETF a "trader with a good track record," and Investor's Business Daily writes "Simon says and the market is playing along."
_____________________________________________________________________________
** March 10, 2021 Special Report: How Rising Treasury Yields Affect Stocks **
Not only the media, also some market forecasters paint a rising yield-based doom-and-gloom scenario for stocks. Elliott Wave International, for example, published the chart below.
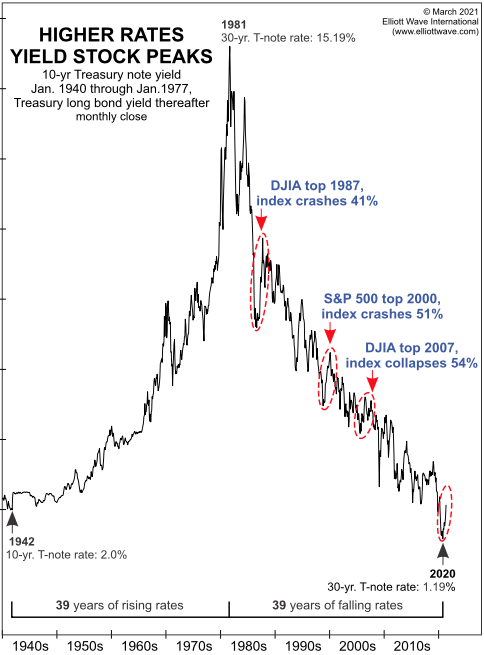
Headlines and annotated charts can easily influence investors, but are they truthful or misleading?
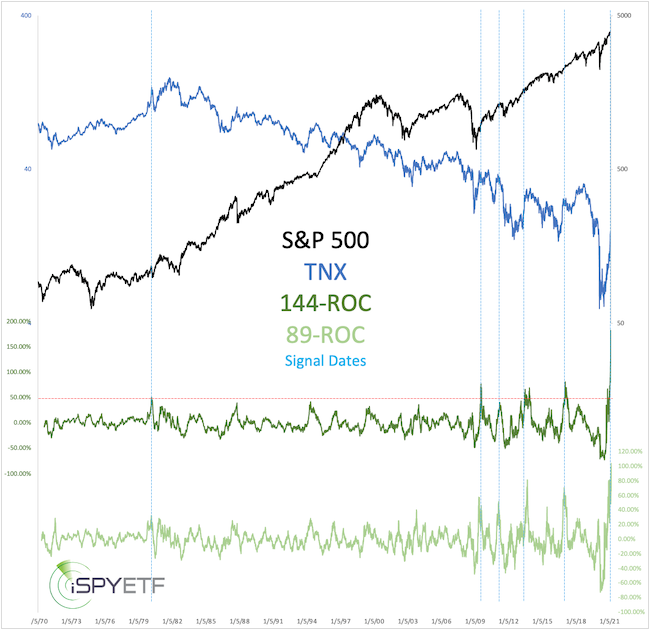
The chart below plots the S&P 500 against TNX (an index based on 10 times the yield-to-maturity on the most recently auctioned 10-year Treasury note). The green graphs show the rate of change (ROC) over 144 and 89 days. Why 144 and 89? We don’t want to cherry pick examples, so I picked two Fibonacci numbers which are roughly equal to 7 and 4.5 months.
As the green graphs show, the ROC briefly exceeded 175% and has never been higher, so we are (again) in uncharted territory. However, the ROC is also elevated because the yield has never been lower.
The dashed horizontal red line allows is to identify other times when the 144-period ROC exceeded 50% The previous 5 times when ROC-144 first exceeded 50% were: 2/26/1980, 7/15/2009, 6/21/2013, 1/11/2017, 11/10/2020 (= signal dates, dashed blue lines).
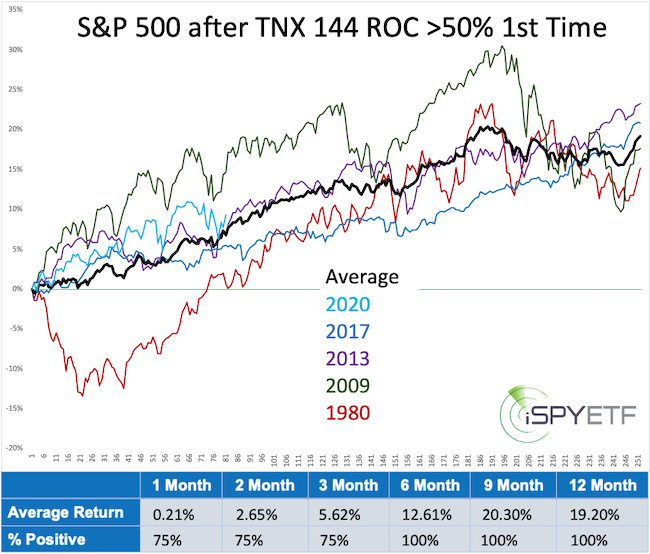
The next chart shows the forward returns for the S&P 500 following the signal dates. The average performance does not include the 2020 signal date. The forward performance of the 11/10/2020 signal data is about in line with the average.
The sample size is small, but aside from the 1980 signal, S&P 500 performance was very positive.
The last chart offers yet another way to examine the effect of rising Treasury yields on the S&P 500. The blue bars highlight periods of rising yields. Aside from the tail end of the 2009 washout decline, rising yields never coincided with a crashing market.
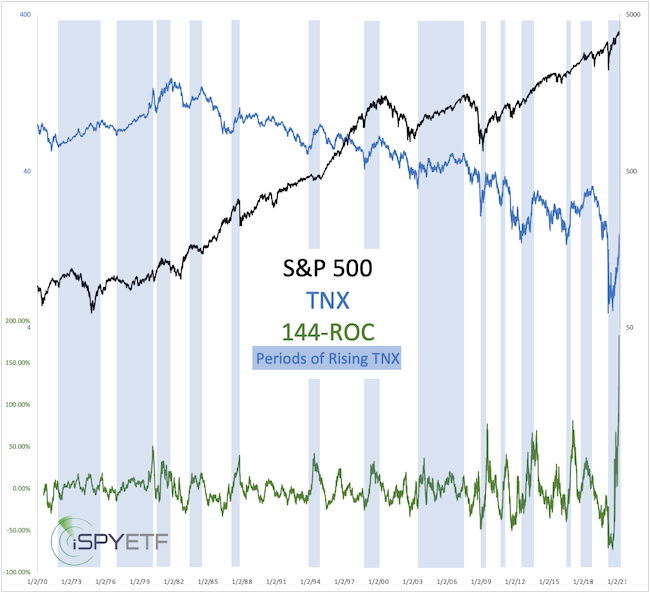
The truth is, historically and statistically, rising 10-year Treasury yields rarely presented a problem for stocks. However, the stock market was more likely to run into trouble when yields stopped rising and started falling. This doesn't mean stocks can't start falling, they can, but it's unlikely to be caused by rising yields.
_____________________________________________________________________________
** March 10, 2021 Special Report: How Rising Treasury Yields Affect Stocks **
Over 5 1/2 years ago, when the media warned investors of an rising rates induced bear market, I laid out the simple facts:
Rising rates are not bearish for stocks.
Now is the time to make decisions based on facts not opinions. Become the best-informed investor you know, sign up for the Profit Radar Report and get access to purely fact-based analysis.
The Profit Radar Report comes with a 30-day money back guarantee, but fair warning: 90% of users stay on beyond 30 days.
Barron's rates iSPYETF a "trader with a good track record," and Investor's Business Daily writes "Simon says and the market is playing along."
|