Subscribers to iSPYETF’s free e-mail newsletter receive a market outlook, usually once a week. The market outlook below was sent out on September 3, 2026. If you’d like to sign up for the free e-newsletter, you may do so here (we will never share your e-mail with anyone, just as we don't accept advertising).
In the age of clickbait, it’s easy for investors to get sidetracked. Clickbait is an overly dramatic or sensationalistic headline designed to attract attention.
Certain investor sentiment readings are often used for clickbait headlines: I.e. the last time investors were as bullish the market crashed.
One of those readings that got some recent attention is the 102.66% long exposure of money managers (polled by NAAIM, see below for explanation).
As with any indicator, the saying “a single arrow is easily broken, but not ten in a bundle,” applies.
When it comes to investor sentiment, the Profit Radar Report consistently monitors nine different sentiment gauges (all explained below) and publishes the Sentiment Picture (available to subscribers).
The Sentiment Picture usually contains two portions:
-
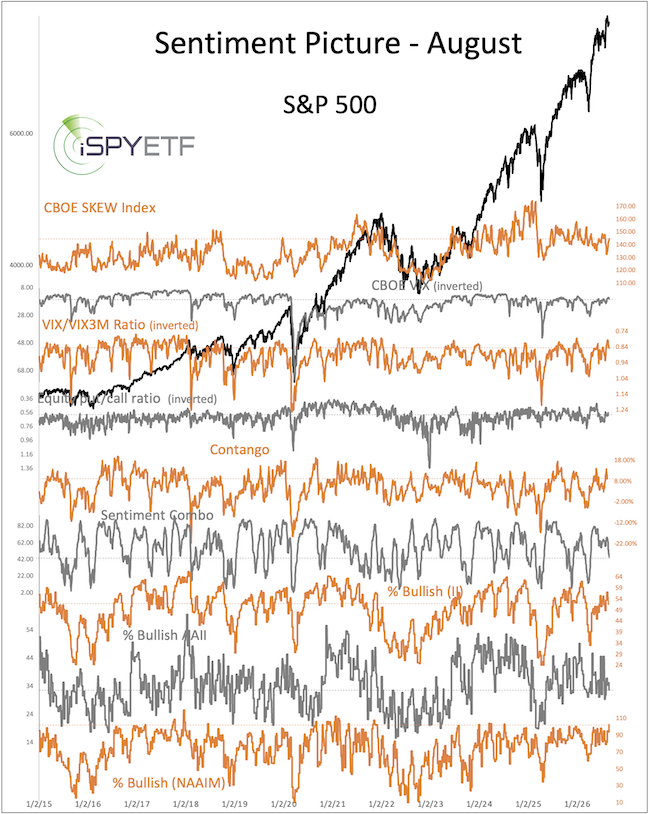
The nine sentiment gauges plotted against the S&P 500
-
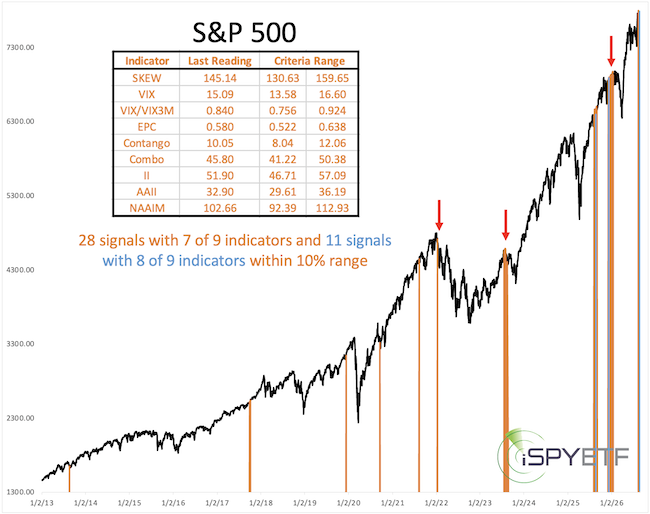
Precedents when the overall investor sentiment (in the past) was the most similar to the current reading.
Step 2. is important because knowing the precedents can make current sentiment readings actionable.
An actual Sentiment Picture says more than a 1,000 words. Below, for your review, is the August Sentiment Picture. Enjoy!
Continued updates and factual out-of-the box analysis are available via the Profit Radar Report.
The Profit Radar Report comes with a 30-day money back guarantee, but fair warning: 90% of users stay on beyond 30 days.
Barron's rates iSPYETF a "trader with a good track record," and Investor's Business Daily writes "Simon says and the market is playing along."
August 2026 Sentiment Picture
Lukewarm has been the theme of the last few Sentiment Pictures ("Not too cold to freeze, not too hot to burn, but lukewarm - a good environment for growth."), and this continues to be the case.
While individual sentiment gauges raised some eyebrows - such as the 102.66% exposure of the NAAIM crowd - the overall sentiment climate remains pretty stale.
Nevertheless, when looking at other times with a similar 'temperature,' there were some troubling precedents (red arrows). We are not betting on a selloff - the weight of evidence does not require one - but it is a possibility this time of year and if we get a selloff we'll consider it a buying opportunity.
Explanation of Sentiment Indicators
CBOE VIX Index: The VIX index is calculated based on near-term SPX (S&P 500) options and represents the market’s expectations for near-term price changes. A VIX reading of 20% theoretically projects a 20% move over the next year. This annualized number can also be transformed into expected monthly or daily volatility (by dividing it by 3.464 or 15.874). For example, a VIX reading of 20 projects a monthly volatility of 5.77% or daily volatility of 1.26%.
VIX/VIX3M ratio: In addition to the VIX - which is designed to measure 30-day volatility - the CBOE (Chicago Board Options Exchange) also calculates 3-month volatility (VIX3M). VIX/VIX3M ratio readings above 1 mean that expected 30-day volatility is higher than 3-month volatility, which is an expression of pessimism. The VIX/VIX3M ratio is a contrarian indicator, therefore readings above 1 are generally bullish for stocks. The opposite is also true, but - as with most indicators - bearish extremes tend to be more reliable than bullish extremes.
CBOE SKEW Index: Like the VIX, the SKEW Index is calculated based on SPX option. Unlike the VIX, which is calculated based on in-the-money-options, the SKEW Index is calculated based on out-of-the-money option. The SKEW shows how expensive put options are relative to calls. The higher the figure, the more expensive puts are. The SKEW Index is designed to detect conditions subject to ‘black swan’ events. A reading of 100 means the risk of a ‘black swan’ event is low. According to the SKEW Index white paper, for every 5-point move the risk of a ‘black swan’ event increases by 1.3 - 1.4%. For example, a SKEW reading of 150 means that ‘black swan’ risk is about 13.5% higher than at a reading of 100.
Contango: Contango is the price decay caused by the process of rolling over futures contracts. High VIX contango readings are usually seen near stock market highs and vice versa. Contango is explained in more detailed here.
CBOE Equity put/call ratio: The CBOE equity put/call ratio is calculated by dividing the number of traded put options by the number of traded call options. A put/call ratio around 0.7 is fairly neutral. Put/call ratios around 1 mean that option traders are betting on lower prices, while a ratio of 0.5 means traders are primarily betting on higher prices. The put/call ratio is a contrarian indication where high readings (>1) are bullish for stocks. The opposite is also true, but - as with most sentiment indicators - high readings (bearish extremes) tend to be more reliable than bullish extremes (low reading).
Sentiment Combo: The Sentiment Combo is a combination of various sentiment gauges.
Investors Intelligence survey (II): Once a week, Investors Intelligence surveys advisors and newsletters writers. The responses are categorized as bullish, bearish or neutral. Our sentiment picture shows the percentage of bullish advisors. The II survey is a contrarian indicatior where high readings are an expression of optimism and low readings an expression of pessimism. Extreme pessimism is usually seen near major lows. The opposite is also true, but - as with most sentiment indicators - bearish extremes (pessimism) tend to be more reliable than bullish extremes (optimism).
American Association of Individual Investors survey (AAII): Once a week, AAII surveys retail investors. The responses are categorized as bullish, bearish or neutral. Our sentiment picture shows the percentage of bullish retail investors. The AAII survey is a contrarian indication where high readings are an expression of optimism and low readings an expression of pessimism. Extreme pessimism is usually seen near major lows. The opposite is also true, but - as with most sentiment indicators - bearish extremes (pessimism) tend to be more reliable than bullish extremes (optimism).
National Association of Active Investment Managers survey (NAAIM): Once a week, NAAIM surveys active money managers regarding the scope of their equity holdings. NAAIM publishes different data points, our sentiment picture shows the average equity exposure of respondents. The NAAIM survey is a contrarian indication where high readings are an expression of optimism and low readings an expression of pessimism. Extreme pessimism is usually seen near major lows. The opposite is also true, but - as with most sentiment indicators - bearish extremes (pessimism) tend to be more reliable than bullish extremes (optimism).
Continued updates and factual out-of-the box analysis are available via the Profit Radar Report.
The Profit Radar Report comes with a 30-day money back guarantee, but fair warning: 90% of users stay on beyond 30 days.
Barron's rates iSPYETF a "trader with a good track record," and Investor's Business Daily writes "Simon says and the market is playing along."
|