Subscribers to iSPYETF’s free e-mail newsletter receive a market outlook, usually once a week. The market outlook below was sent out on May 21, 2026. If you’d like to sign up for the free e-newsletter, you may do so here (we will never share your e-mail with anyone, just as we don't accept advertising).
Epic, unprecedented, unpredictable, mind boggling … take your pick, any of those adjective describes the stock rally from the March low.
The semiconductor sector (SOX) propelled this rally into extraordinary territory. At some point, SOX flashed a 1-year gain of 170% and traded some 64% above its 200-day SMA.
Thanks to SOX, the tech sector now accounts for about 37% of the S&P 500. Mighty tech fueled the surge and at the same time conceals the lagging herd.
For example, at the most recent all-time high (ATH), the S&P 500 traded 7.89% above its 50-day SMA while 53% of NYSE-traded stocks remained stuck below their respective 50-day SMA. This has never happened before.
Regardless of how rare or unlikely the recent batch of superlatives are, it is what it is, and we have to deal with it and make sense of it. So let’s do that:
Overall stock market breadth has been poor by various measures.
The cumulative NY Composite advance/decline line - by manny considered the gold standard of breadth indicators - is lagging.
I’ve used the NYC a/d line successfully for over a decade, way before it became popular. But any indicator that becomes too popular loses its effectiveness, and that’s been the case with the NYC a/d line as well.
Highlighted in orange on the S&P 500 chart below is every ‘bearish divergence’ since late 2023. There have been countless bearish divergences that haven’t mattered.
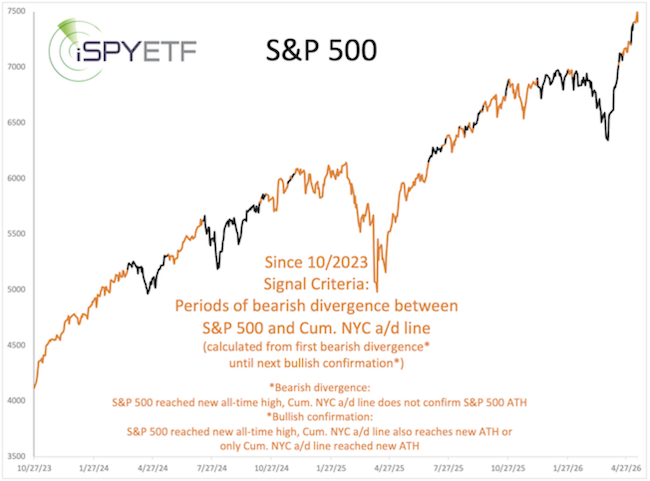
Starting in the Profit Radar Reports 2024 S&P 500 Forecast I warned that bearish divergences are prone to be erased and no longer actionable. When an analyst or headlines predicts doom and gloom because of the lackluster NYC a/d line, remember the chart above.
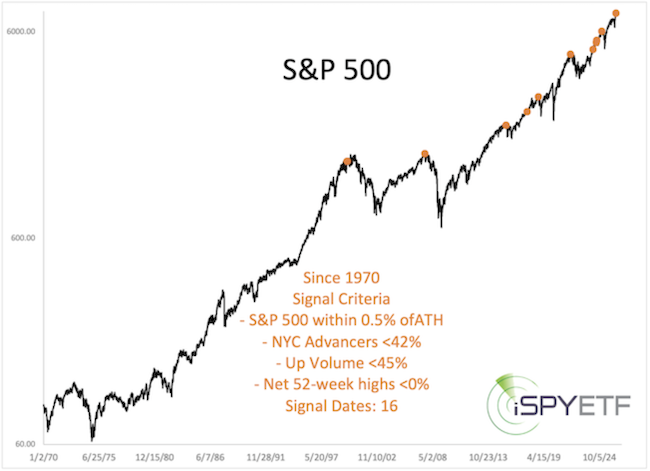
Another anomaly (seen at the May 14, S&P 500 ATH) is that declining stocks outnumbered advancing stocks (61% to 39%) and new 52-week lows outnumbered highs (4.15% to 4%). Going back to 1970, while at an ATH, with a bearish NYC a/d line divergences, this happened only 1 other time (6/11/2024).
If we replace the “new S&P 500 ATH with bearish NYC a/d line divergence” criteria with “S&P 500 within 0.5% of ATH,” we get 16 signals confined to 10 clusters. At least 5 of the prior 9 clusters were followed by pullbacks or eventual, sizable drops.
From a technical perspective, the S&P 500 is pushing up against Fibonacci resistance at 7,401 - 7,431.
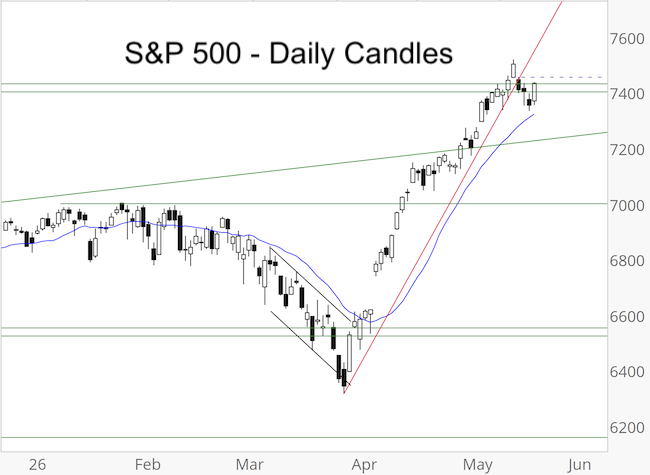
The Profit Radar Report’s 2026 S&P 500 Forecast projected a S&P rally that briefly exceeds 7,401 - 7,431 in May 2026. This has happened, what's next?
Summary
Right at the March low, the Profit Radar Report recommended buying stocks in case a low is in. The subsequent rally dwarfed all expectations and now delivered a constellation that warrants caution.
Don't forget, this is a momentum market and a momentum market has its own rules. My #1 rule, is to keep it simple:
Therefore, as long as below resistance at 7,401 - 7,431, it's best to allow for lower prices. Only a break above that resistance would postpone any weakness.
For continuous fact-based, objective, out-of-the box, hand-crafted analysis, sign up for the Profit Radar Report and become the best informed investor you know.
The Profit Radar Report comes with a 30-day money back guarantee, but fair warning: 90% of users stay on beyond 30 days.
Barron's rates iSPYETF a "trader with a good track record," and Investor's Business Daily writes "Simon says and the market is playing along."
|
