Subscribers to iSPYETF’s free e-mail newsletter receive a market outlook, usually once a week. The market outlook below was sent out on 4/23/2026. If you’d like to sign up for the free e-newsletter, you may do so here (we will never share your e-mail with anyone, just as we don't accept advertising).
The last FREE Market Outlook (March 18, 2026) stated that: “We closed long stock positions in February with the intent of buying at lower prices. We are now getting closer to our first support/buy level.”
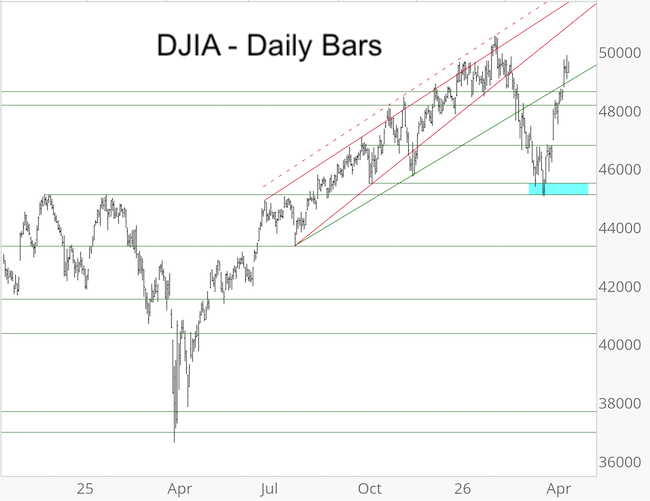
In late March, the Dow Jones Industrial Average (DJIA), reached our buy zone and we bought DIA.
The blue box in the chart below highlights our support/buy zone (the buy limit for DIA was 454). We also had a pending buy limit for the S&P 500 (SPY), but that was not reached.
The Iran war did not deter our bullish outlook just as the Ukraine war did not deter us years ago. The weight of (objective, non-emotional) evidence simply pointed higher.
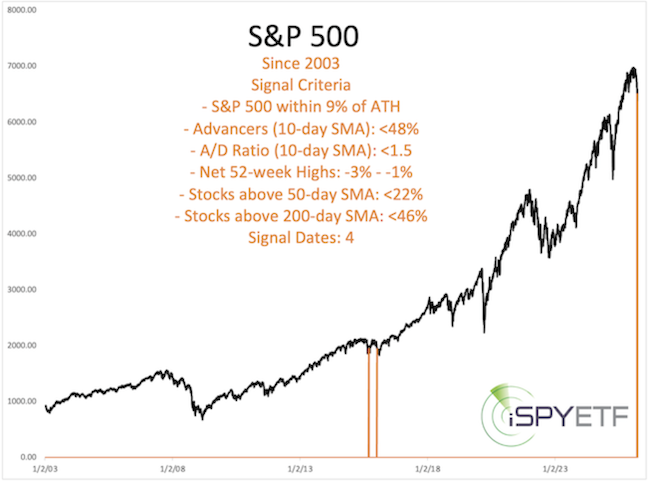
For example, the March 29, Profit Radar Report looked at market breadth and published the following chart and comment:
“Overall breadth readings are still unique with very few precedents, but the 2 precedents happened near lows.”
In recent years, the stock market has delivered many uncommon and unusual readings and patterns, but looking at historically similar circumstances has kept us on the right side of the trade.
I know, DJIA did not rally as strongly as other indexes (discussed below), but we bought at a time when others were selling. And I am the first to admit that I did not expect stocks to rally with such ferocity and resilience against any meaningful drawback, but that doesn't make the buy signal less valuable.
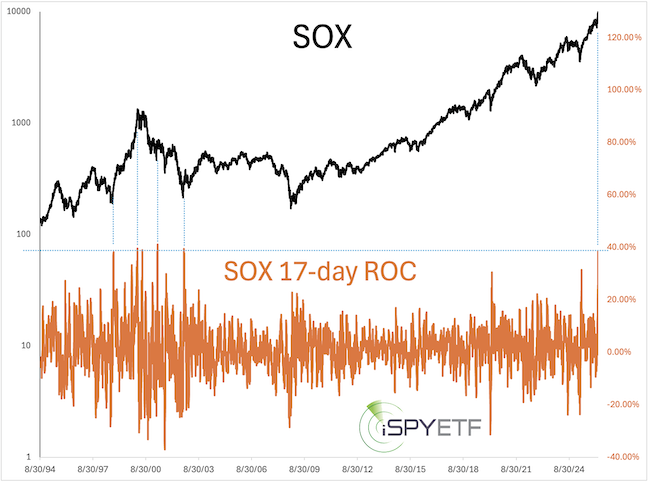
The SOX (Philadelphia Semiconductor Index) rallied 38.74% in the 17 days since the March low. There have only been 4 other times when SOX rallied as much as quickly. The dashed blue lines below highlight those instances.
Although not as spectacular as SOX, the S&P 500 rallied 12.3% within the 13 days following its March low. Such quick pops are not unusual for the S&P, it happened 54 other times (since 1970).
However, quick pops that carry the index to new all-time highs are very rare. There are only 12 other times (since 1970) when the S&P rallied more than 11% in a 13-day period (ROC-13) and those 12 signals dates are confined to 5 clusters.
As the chart below shows, the most recent happened 3/24/2000, the day of the dot-com bubble top.
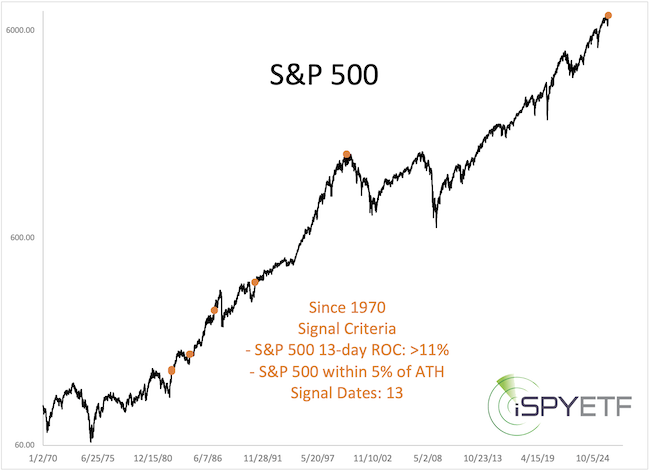
This is an ominous precedent and would make for a catchy headline, but the ‘scary’ dot-com bubble signal is much different from the current signal … at least that’s what an objective evaluation of the evidence shows.
If you want to examine the evidence for yourself, sign up for the Profit Radar Report for instant access to the current research and all future updates.
Gold/GLD Update
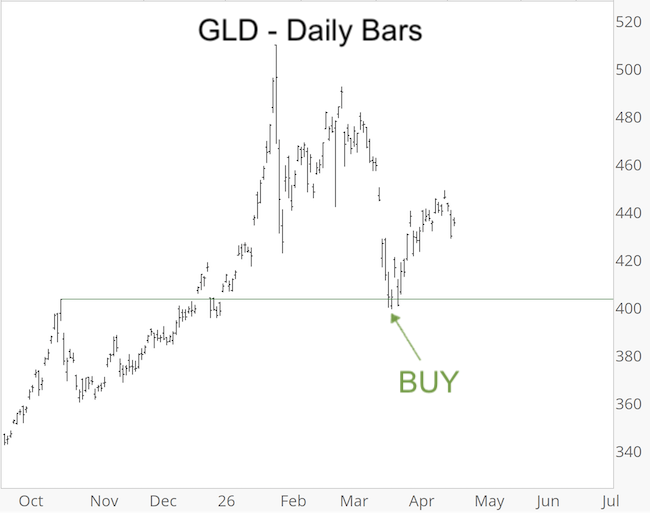
The last FREE Market Outlook (March 18, 2026) brought out that: “An eventual drop below the February 2 low would make buying gold more interesting.”
This drop happened shortly thereafter and the Profit Radar Report recommended to buy GLD below 400. The March 25 Profit Radar Report explained why:
“GLD tested support and dipped below 400, which is where we bought GLD. We bought GLD because RSI-2 was over-sold for the 4th consecutive day while being at important support. This was a low-risk buy setup. The setup itself is short-term in nature and doesn’t tell us anything about the mid-or long-term outlook. Gold is likely to rally to new all-time highs eventually. Before it does, it can still suffer a drop towards the 10/28/25 low at 3,901 (gold futures) or 360.12 (GLD) by mid-April (blue box). If support around 3,900 fails, gold could drop even further.
If gold continues to rally without new low, we got a good entry. If gold relapses, we have to choose between selling GLD and waiting for a better entry or simply hold on (accept a temporary drawdown in exchange for not missing out on the up side) and add to the existing position at lower prices.”
At the beginning stage of an 'event' - such as the Iran war or tariffs - the stock market can be news-driven, but after a while investors get desensitized to the news flow and normal market dynamics tend to take control.
The Profit Radar Report examines and analyzes the signals offered by the market and interprets them for investors.
Become the best informed investor you know, don't get fooled by the news or catchy headlines, sign up for the Profit Radar Report Profit Radar Report.
The Profit Radar Report comes with a 30-day money back guarantee, but fair warning: 90% of users stay on beyond 30 days.
Barron's rates iSPYETF a "trader with a good track record," and Investor's Business Daily writes "Simon says and the market is playing along."
|
