Subscribers to iSPYETF’s free e-mail newsletter receive a market outlook, usually once a week. The market outlook below was sent out on September 4, 2025. If you’d like to sign up for the free e-newsletter, you may do so here (we will never share your e-mail with anyone, just as we don't accept advertising).
The stock market has been on a tear since April … but the September/October window has a reputation to ruffle investors’ feathers.
Procrastination or ignorance are the enemies of stock market gain stick-to-itiveness, so now is a great time to run a serious scan on stock market health.
It’s said that an ounce of prevention is worth a pound of cure. The results and conclusions of a detailed stock market scan can prevent losing gains or losing out on gains.
- Here is the 1st must do scan: Market breadth
Is underlying market breadth stronger or weaker than S&P 500 price action suggests?
The chart below plots 6 different stock market breadth indicators against the S&P 500.
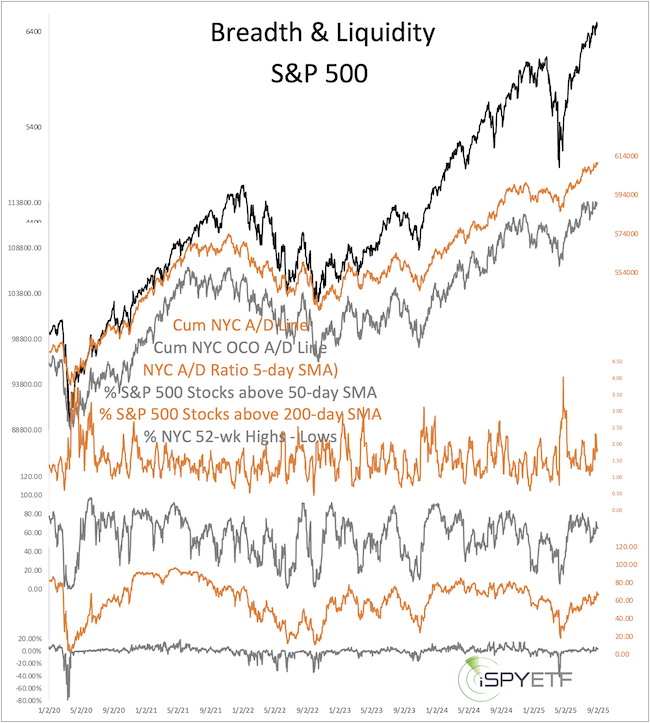
Aside from minor divergences prior to the latest all-time high, the cumulative NY Composite advance/decline lines confirmed S&P 500 strength.
Other measures, like the percentage of stocks above their 50-and 200-day SMAs and new 52-week highs, improved recently but are not as strong as at least year’s all-time highs.
- Here is the 2nd must do scan: Investor sentiment
It's a busy chart, but the simple message of the 9 investor sentiment gauges shown below is this:
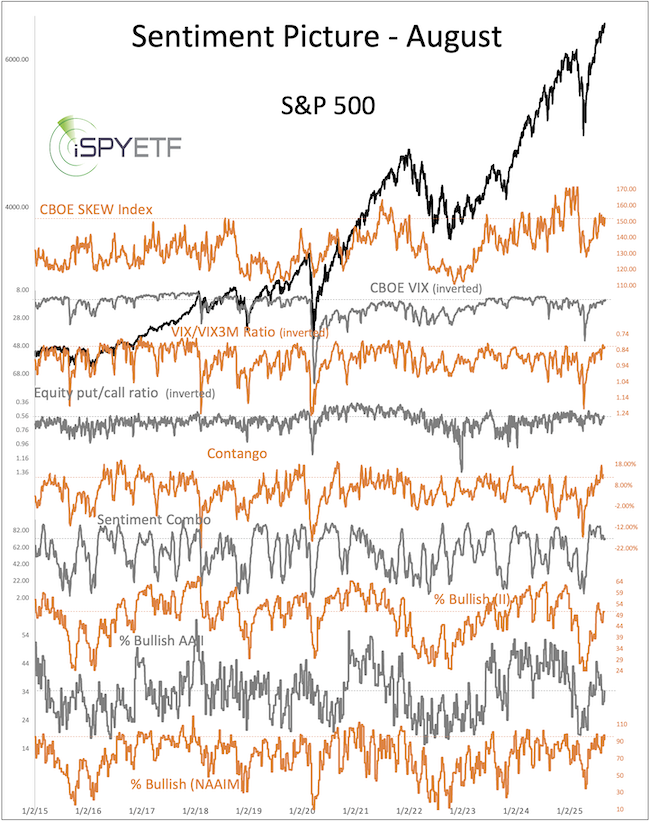
Investors are feeling overall optimistic, but by no means enthusiastic. It’s unbridled enthusiasm that’s usually seen before the crash.
- Noteworthy outlier scan results
A scan of price and breadth patterns revealed some very unique outlier readings:
- Since the April low, the S&P 500 gained as much as 30.49%.
- Since the April high, the VIX lost as much as 72.83%. Tuesday was the 100-day anniversary of the April low. Since 1990, there have only been 19 other times when the S&P rallied >25% and the VIX dropped >50% in a 100-day span. Those 19 signals all occurred during 2 specific time periods only.
- The biggest outlier: On August 22, the S&P 500 closed at a new all-time high (ATH) with 90.11% of NYSE-traded stocks advancing on 90.90% of volume (called a 90% up day).
Are 90% up days on ATHs ‘flame out days’ (last hurrah before the next drop) or signs of sustainable strength?
Making scans actionable
Scans like this are incredibly important to assess the ‘internal health’ of the stock market and in particular the latest rally leg.
In order to make the scan results actionable, the Profit Radar Report not just scans the market internals, it also puts the results into contest by identifying other periods of time with the same scan results (or conditions).
Just as an experienced doctor looking at an EKG knows which ’squiggles’ or chart abnormalities tend to lead to a heart attack (or not), the Profit Radar Report looks at the charts to see if unique chart developments tend to be signs of trouble.
Sunday’s Profit Radar Report identified other times when:
- Market breadth showed the same readings as those at the last all-time high
- Investor sentiment was most similar to that seen at the last all-time high
- The S&P 500 rallied more than 25% and the VIX dropped more than 50% in a 100-day span
- The S&P 500 closed at a new all-time high on 90% (and 85%) up days
Knowing how the S&P 500 performed at similar junctures in the past helps us asses whether the 'patient is in trouble or not.'
For continued out-of the box, objective, purely fact-based analysis, test drive the Profit Radar Report and become the best informed investor you know.
The Profit Radar Report comes with a 30-day money back guarantee, but fair warning: 90% of users stay on beyond 30 days.
Barron's rates iSPYETF a "trader with a good track record," and Investor's Business Daily writes "Simon says and the market is playing along."
Subscribers to iSPYETF’s free e-mail newsletter receive a market outlook, usually once a week. The market outlook below was sent out on January 28. If you’d like to sign up for the free e-newsletter, you may do so here (we will never share your e-mail with anyone, just as we don't accept advertising).
Continued updates and factual out-of-the box analysis are available via the Profit Radar Report.
The Profit Radar Report comes with a 30-day money back guarantee, but fair warning: 90% of users stay on beyond 30 days.
Barron's rates iSPYETF a "trader with a good track record," and Investor's Business Daily writes "Simon says and the market is playing along."
|
