The Financial Select Sector SPDR (NYSEArca: XLF) chart below features exactly the same support/resistance levels highlighted in my September 12 article about XLF.
It is interesting to note that XLF has come back to test support made up of prior support/resistance levels at 20.30 – 20.50.
We also note that XLF peeled away from resistance at 21.15, which was the September 2001 monthly candle low.
I’ve kept past trend lines on the chart to illustrate that XLF tends to respect support/resistance trend lines created by prior price action.
The green bubble, for example, marks a technical breakout in August 2012. This breakout was foretold by the August 5, 2012 Profit Radar Report, which stated that: “Financials are currently underloved. With such negative sentiment, a breakout above 14.90 could cause a quick spike in prices.”
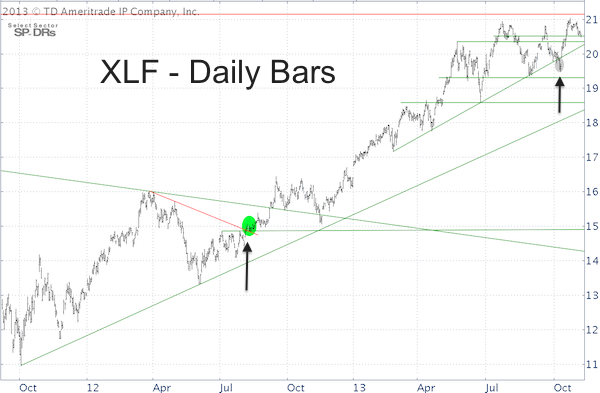
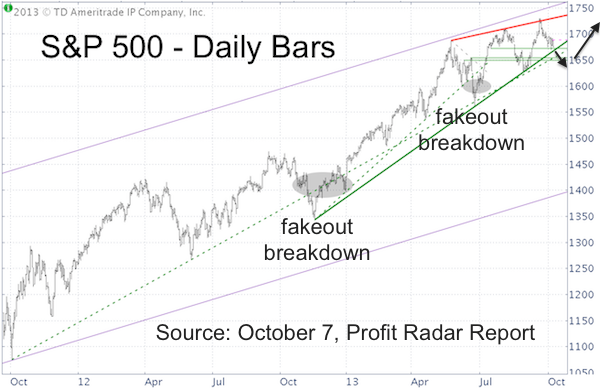
The gray bubble highlights a fakeout trend line break, which can also be seen on the S&P 500 (SNP: GSPC) chart.
In fact, the October 7 Profit Radar Report expected the fakeout trend line break for the S&P 500 (at the time the S&P 500 trend line was at 1,668) and stated that: “A dip below 1,668 followed by a close above 1,671 would most likely be a buy signal.”
The fakeout dip below support was expected based on prior fakeout breakdowns that led to new highs (see chart below, originally published in the October 7 Profit Radar Report).
The S&P 500 (NYSEArca: SPY) and Nasdaq Composite (Nasdaq: ^IXIC) are currently bouncing against major long-term resistance. Failure to overcome resistance may cause a correction.
That’s why this support shelf for XLF gains additional importance. A drop below support for XLF will likely indicate more down side, while the ability to stay above would be net bullish for the broad market. The chart for the Vanguard Financial ETF (NYSEArca: VFH) looks similar.
Summary
Investors should keep a close eye on whether support for XLF and resistance for the S&P 500 and Nasdaq holds.
As long as both hold, the broad market is ‘trapped’ in a sideways range (as we’ve seen over the last two weeks).
Where is key resistance for the S&P 500 and Nasdaq? Detailed charts and commentary are available here: Nasdaq and S&P 500 Held Back by ‘Magic’ Resistance.
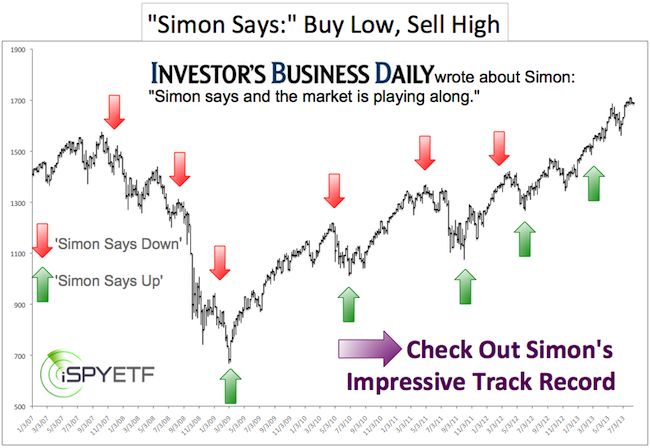
Simon Maierhofer is the publisher of the Profit Radar Report.
Follow Simon on Twitter @ iSPYETF or sign up for the FREE Newsletter.
|
