How quickly things change. Just a week or two ago, stocks tumbled and fear soared.
The first wave of re-emerging ‘Grexit’ fears (June 28) knocked the S&P 500 down 45 points in one big swoop, and another 15 points via a 7-day grind (see chart).
Thanks to hopes for an ‘aGreekment,’ stocks soared higher this week.
Of course, it’s easy to explain the past with hindsight and a few news events. The problem with this approach is that it only works in hindsight, since no one can foretell future news.
A more comprehensive approach generally offers better foresight.
Will the S&P 500 Rally to New All-time Highs?
A look at the past will help determine what’s next (take a moment to inspect the chart).
Commenting on the big June 28 decline, the June 29 Profit Radar Report stated the following:
“Nothing is eaten as hot as it's cooked. It's probably best to give it some time to let the initial kneejerk reaction shake out, and re-evaluate once things settle. Support at S&P 2,072 may be broken, but a news-event driven break is probably not as meaningful as an 'organic' break.”
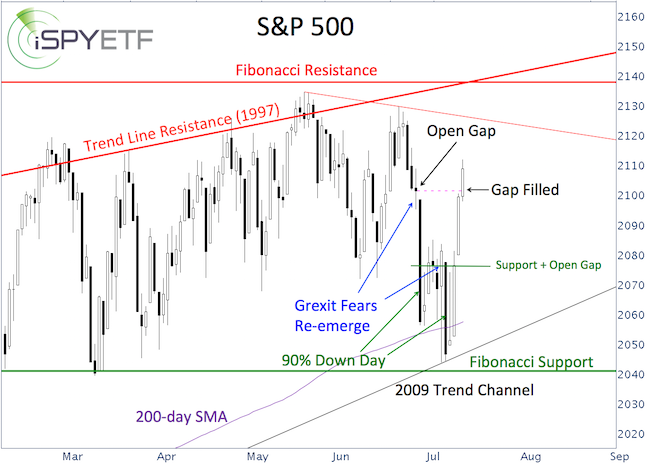
Following the initial June 29 mini-meltdown, the S&P 500 (NYSEArca: SPY) bounced around until it got hit again on July 8, when it closed below the 200-day SMA for the first time since October 20, 2014.
On that day (July 8), the Profit Radar Report wrote that: “We don’t put too much weight on today’s close below the 200-day SMA. More important is support at 2,040. Today’s decline may have exhausted selling, at least temporarily. The odds for a bounce are good. The open gaps at 2,081 and 2,101 could be targets”.
If you enjoy quality, hand-crafted research, >> Sign up for the FREE iSPYETF Newsletter
Here is where understanding how a price bottom came to be (although it’s rear-view mirror analysis) can be valuable.
The June 29 and July 8 mini-meltdowns were 90% down days, which means that 90% or more of volume was to the down side, and 9 out of 10 stocks closed lower. Multiple 90% down days can be a reflection of exhausted selling pressure (washout, or throw-in-the-towel moves).
Based on the two 90% down days, the June 8 closing low may lead to new highs.
The up side target (open chart gap at 2,101 – dashed pink line on chart) was captured today.
Unfortunately, that puts the S&P 500 in a sticky spot. Short-term overbought, but with the potential of having established a more robust low.
Stocks are reaching overbought territory, so resistance at 2,115 – 2,125 is worth watching for a pullback or relapse.
There is no high probability setup right now, but my best guess is that new highs will be coming, perhaps after a smaller pullback.
Support (and an open chart gap) around 2,080 may be a low-risk spot to buy (with tight stop-loss). Failure to hold 2,080 and more importantly 2,040, could unlock much lower targets.
Continued analysis, based on sentiment, seasonality, technical analysis, supply & demand (and a little bit of news) is available via the Profit Radar Report.
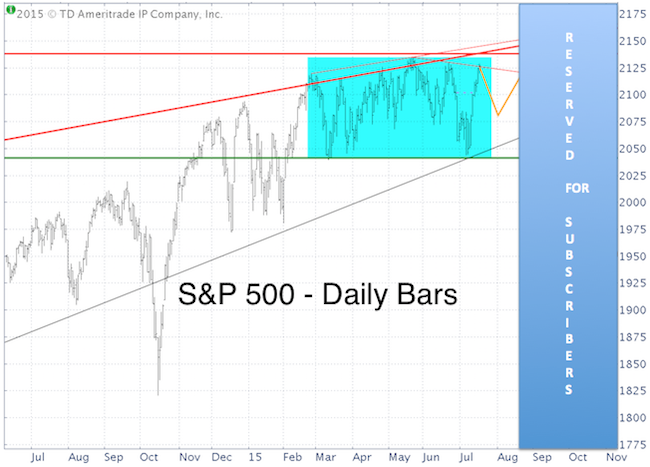
UPDATE:
The following S&P 500 projection was featured in the July 19 Profit Radar Report:
Simon Maierhofer is the publisher of the Profit Radar Report. The Profit Radar Report presents complex market analysis (S&P 500, Dow Jones, gold, silver, euro and bonds) in an easy format. Technical analysis, sentiment indicators, seasonal patterns and common sense are all wrapped up into two or more easy-to-read weekly updates. All Profit Radar Report recommendations resulted in a 59.51% net gain in 2013 and 17.59% in 2014.
Follow Simon on Twitter @ iSPYETF or sign up for the FREE iSPYETF Newsletter to get actionable ETF trade ideas delivered for free.

If you enjoy quality, hand-crafted research, >> Sign up for the FREE iSPYETF Newsletter
|
