“All’s well that ends well.” Monday on Wall Street started out with a bang, but didn’t end well.
Two of the most bearish charts are Apple and Nasdaq-100 (Nasdaq: QQQ).
AAPL opened at 461, but was down 3.18% by the close.
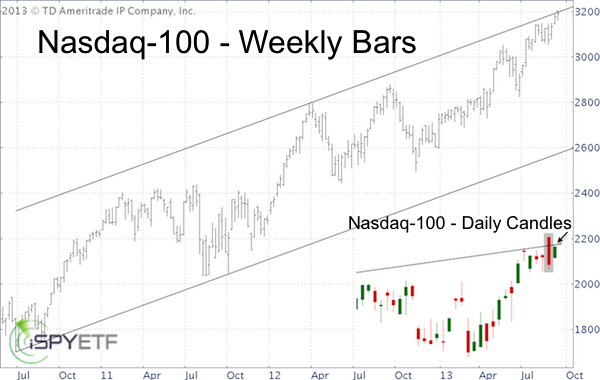
The Nasdaq-100 lost over 1% over the course of the day.
On the surface the Nasdaq’s (Nasdaq: ^IXIC) performance doesn’t look bad (it lost 1%, so what?), but the devil is in the details.
The chart below highlights why Monday’s reversal could be more bearish than the 1% decline suggests.
Please note the 46-month trend channel (black lines). Monday’s open propelled trade outside the trend channel before reality reeled price back in.
The chart insert shows that Monday’s action created a red candle high. In summary we have a red candle high after a potential throw-over top with a close below key resistance.
Nevertheless, I can’t bring myself to get overly bearish. I discuss why and what exactly this formation means via the Profit Radar Report. The black trend line is now the 'line in the sand' between short-term bullish and bearish potential.
Another AAPL Breakdown?
AAPL has given back all the gains since it’s technical breakout on August 2 (the green circle highlights when the Profit Radar Report issued a buy signal).
The prior breakout level at 450 - 447 (where AAPL closed yesterday) is now soft support. Other than that the AAPL chart doesn’t offer many directional clues for the stock or must hold support levels.
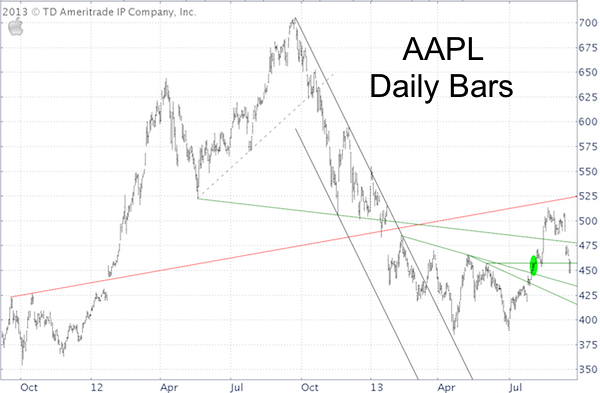
But, AAPL is the ‘alpha male’ for US stocks, the biggest company in the world (based on market capitalization) and the biggest component of the Nasdaq and S&P 500 (SNP: ^GSPC).
It accounts for 12.21% of the Nasdaq QQQ ETF, 2.9% of the S&P 500 ETF (NYSEArca: SPY) and 14.38% of the Technology Select Sector SPDR ETF (NYSEArca: XLK). Let’s dig deeper.
My market outlooks are always based on, what I call, the three pillars of market forecasting: technical analysis, sentiment and seasonality.
We just looked at technical analysis and there are no sentiment extremes.
However, Apple is about to encounter the most powerful seasonality of the year, and purely based on seasonality I would not want to own Apple right now.
This seasonality is based on historic price action going all the way back to 1998, when Steve Jobs U-turned Apple from near bankruptcy to profitability.
The full AAPL seasonality chart along with its potent message can be found here:
Apple (AAPL) Seasonality Chart
Simon Maierhofer is the publisher of the Profit Radar Report.
Follow Simon on Twitter @ iSPYETF or sign up for the FREE Newsletter.
|
