The S&P 500 lost as much as 229 points or 10.92% in three days. The Nasdaq lost as much as 763 points or 16.77% over the same three days.
Wow. To be honest, I did not see that one coming, at least not as intense.
However, there were tell tale signs – a writing on the wall – that a big selloff is a real possibility. There was no reason for us to own stocks.
Here are three factors that caused (or certainly contributed) to this 3-day meltdown, and what they mean going forward:
‘Bad Breadth’
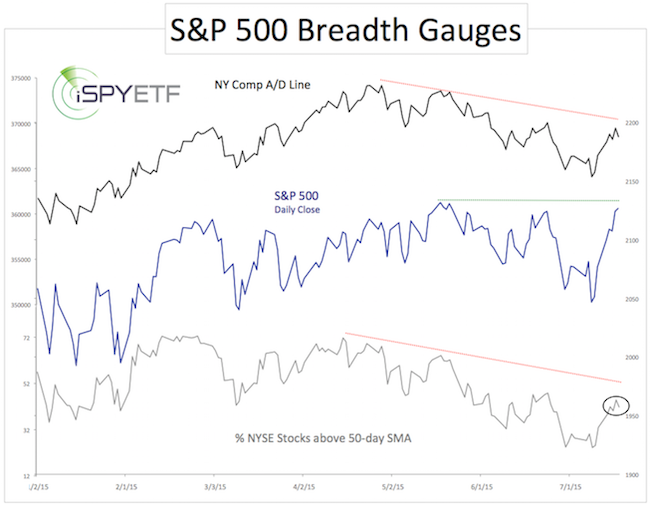
We have looked at the market’s internal deterioration (‘bad breadth’) many times in recent weeks (the last time was here).
The July 19 Profit Radar Report published this chart and warning (the S&P closed at 2,126 that day):
“Although investors are buying, the surge in demand (appearance of buyers) has not been commensurate to the surge in price. The percentage of stocks above their 50-day SMA graph shows that investors are very selective right now. Only 41% of NYSE stocks are above their 50-day SMA, compared to 71% in April and 61% the last time the S&P was near 2,130 (late May). There’s a short-term bearish divergence, as the S&P 500 moved higher on Friday, but the percentage of stocks above their 50-day SMA lower.”
Mutual Fund Cash Levels
The August 2 Profit Radar Report looked at mutual fund cash levels and noted the following: “One of the bigger worries could be mutual fund cash levels, which just dropped to 3.2%, an all-time low. If a large number of investors decide to sell, fund managers will be forced to sell fund holdings, which has the potential to turn into a chain reaction.”
Elliott Wave Theory
Elliott Wave Theory. Some love it, others hate it. I’ve found that there are times where EWT is very helpful, if interpreted correctly.
The August 16 Profit Radar Report said this about the bearish potential of EWT:
“A break below 2,052 may indicate a wave 3 lower.”
What is a wave 3? The third wave of an Elliott Wave pattern is always the most powerful one. It generally goes further than expected.
What’s Next?
Elliott Wave Theory may hold the most clues about what’s next for stocks. Based on the intensity of this selloff, it is likely to turn into a 5 wave decline with a more lasting low in October, similar to 2011. Here is how things looked and turned out in 2011.
Simon Maierhofer is the publisher of the Profit Radar Report. The Profit Radar Report presents complex market analysis (S&P 500, Dow Jones, gold, silver, euro and bonds) in an easy format. Technical analysis, sentiment indicators, seasonal patterns and common sense are all wrapped up into two or more easy-to-read weekly updates. All Profit Radar Report recommendations resulted in a 59.51% net gain in 2013 and 17.59% in 2014.
Follow Simon on Twitter @ iSPYETF or sign up for the FREE iSPYETF Newsletter to get actionable ETF trade ideas delivered for free.

If you enjoy quality, hand-crafted research, >> Sign up for the FREE iSPYETF Newsletter
|
