In September 2012, Apple (NasdaqGS: AAPL) accounted for 20% of the Nasdaq-100 and 5% of the S&P 500 (NYSEArca: SPY).
AAPL was the single most influential stock in the financial universe, the MVP of the Nasdaq and S&P 500.
It was back then when I decided to put together an Apple seasonality chart for Profit Radar Report subscribers. Apple seasonality is based on daily price action going back to 1998, which is the year Steve Jobs came back to U-turn Apple from near bankruptcy to profitability.
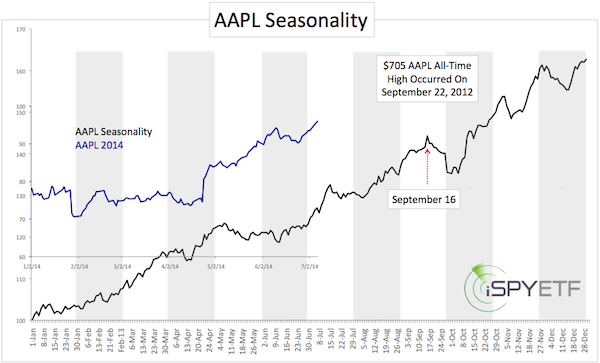
Since 1998, AAPL has gone from $1 to $100, so the seasonal bias is distinctively bullish in most months. The biggest exception is September.
AAPL seasonality was one of the reasons why the Profit Radar Report turned bearish on Apple and issued this, at the time shocking recommendation, on September 12, 2012:
“Aggressive investors may short Apple (or buy puts or sell calls) above 700 or with a close below 660.”
AAPL seasonality shows some weakness in mid-July, but projects higher prices from early August to mid-September.
The interesting thing about AAPL seasonality is that it doesn’t really match up with S&P 500 seasonality. The 2012/2013 AAPL bear market has shown that the S&P 500 (SNP: ^GSPC) doesn’t have to move in the same direction as AAPL.
Although AAPL is only 5% away from its all-time high, AAPL lost its dominance. Today AAPL makes up ‘only’ 13.24% of the Nasdaq-100 and only 3.22% of the S&P 500.
That’s because other stocks like Google, Microsoft and Amazon have rallied, while AAPL is trying to recover from its bear market.
Obviously, seasonality is only one factor that affects stocks. Here are five other things to consider about Apple:
3 Reasons Why Apple is a Buy – and 2 Reasons Why Not
Simon Maierhofer is the publisher of the Profit Radar Report. The Profit Radar Report presents complex market analysis (S&P 500, Dow Jones, gold, silver, euro and bonds) in an easy format. Technical analysis, sentiment indicators, seasonal patterns and common sense are all wrapped up into two or more easy-to-read weekly updates. All Profit Radar Report recommendations resulted in a 59.51% net gain in 2013.
Follow Simon on Twitter @ iSPYETF or sign up for the FREE iSPYETF Newsletter to get actionable ETF trade ideas delivered for free.

|
