We’ve been using the Russell 2000 Index as a ‘thermometer’ to see if the market is getting overheated. How can any one index work as a thermometer?
As rallies or bull markets mature, investors typically find fewer and fewer stocks at a price tag that justifies buying. Mature rallies are therefore accompanied by selective buying.
Selective buying is just a fancy expression for some indexes beginning to lag and underperform. High beta indexes, like small caps, are usually the first to be left in the dust.
That’s exactly what happened in early April, particularly on April 10. The S&P 500 rallied to new all-time highs. The Russell 2000 did not.
The April 10, Profit Radar Report pointed out just that: “The stock market has arrived at a point where selective buying is cautioning of a looming high. Upcoming resistance levels and divergence spreads (i.e. Nasdaq-100 compared to Nasdaq Composite, DJIA compared to DJA, and S&P 500 compared to Russell 2000) provide a low-risk opportunity to go short.”
In other words, there is a low-risk opportunity to go short as long as the Russell 2000 remains below its all-time high (recorded on March 15).
The purple bar in the chart below highlights the difference between the April 10 and March 15 highs, seven points. The risk of going short on April 11 was seven points. So far the Russell 2000 has fallen as much as 48 points. This is a risk/reward ratio of almost 7:1 in your favor.
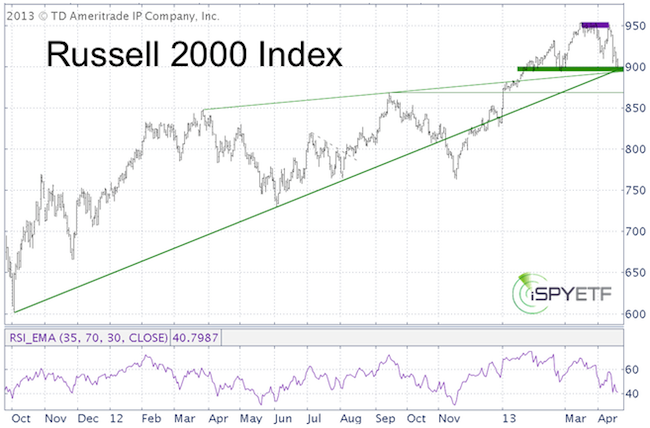
On Thursday the Russell 2000 closed right above important triple support. Although RSI (bottom of chart) did not yet confirm the new price low, it failed to provide an obvious bullish RSI divergence. This suggests that any bounce at current support will lead to at least one more leg down.
A move below 890 should minimally lead to a test of 868, possibly lower.
The second chart shows the same support levels for the iShares Russell 2000 Index ETF (IWM). IWM already closed below the two ascending trend lines. Once price drops below support it turns into resistance (that’s why the trend lines are colored red).
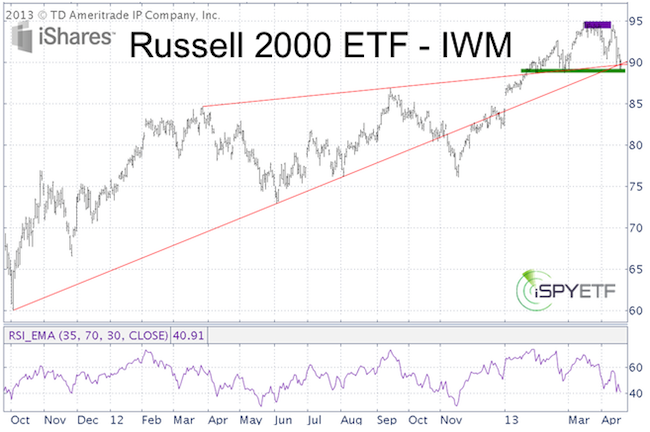
IWM may foreshadow what’s next for the Russell 2000, but when it comes to trading/investing, I base my technical analysis on the purest representation of the respective asset. The purest representation of the Russell 2000 is the Russell 2000 Index, not the Russell 2000 ETF.
Nutshell summary for IWM: Based on trend line support for the Russell 2000 Index, small caps are likely to find support around current prices, but should ultimately move lower before embarking on a more sizeable rally again.
The ETF SPY provides FREE weekly trade set ups. >> Sign up for the free newsletter to get future ETF SPY ideas.
Follow up on prior ETF SPY Picks:
April 12: GDX broke through support with a vengeance. A new low is likely before we’ll see a significant rally.
April 5: XRT closed below trend line support and registered a failed bullish percentR low-risk entry (lingo for: the up trend is likely broken). XRT is still trading above support at 68.70.
March 22: AAPL’s break above trend channel was a fake out break out. The March 31, Profit Radar Report stated that: “Apple failed to bounce from parallel channel support (on the log scale chart) and closed below. Our stop-loss was triggered and the option of much lower prices is now on the table. I'd like to see further confirmation, but the potential target for Apple may be as low as 353. Support at 425 - 405 could soften or halt the decline.”
March 15: XLF trades as high as 14.65, which was right in the 18.52 – 19.66 resistance cluster that was likely to halt XLF’s rally.
March 7: The Nasdaq-100 (corresponding ETF: QQQ) had two open chart gaps: 2,806 and 2,860. Although it seemed unlikely at the time, the Nasdaq-100 closed the gap at 2,860 on April 10 before declining well over 100 points.
The ETF SPY provides FREE weekly trade set ups. >> Sign up for the free newsletter to get future ETF SPY ideas.
|
