“The trend is your friend”
“Stay long until you’re long”
“Don’t fight the Fed”
You’re a happy man (or woman) if your most recent five-year plan was based on any of the above idioms.
Here’s another one, a German one:
“Everything’s got an end, only sausages have two”
Yes, even the post 2009 QE bull market will come to an end. Is the anemic 2014 performance the beginning of the end?
Three Bearish Tell Tale Signs
Bull market tops are a process, not an event. Fragmentations and divergences are part of the process.
Fragmentation: The Dow Jones topped on December 31, the S&P 500 on January 15, the Nasdaq-100 and Nasdaq Composite (Nasdaq: ^IXIC) on January 22, the Dow Jones Transport on January 23.
Symptoms don’t lie. A fragmented market is a sick market.
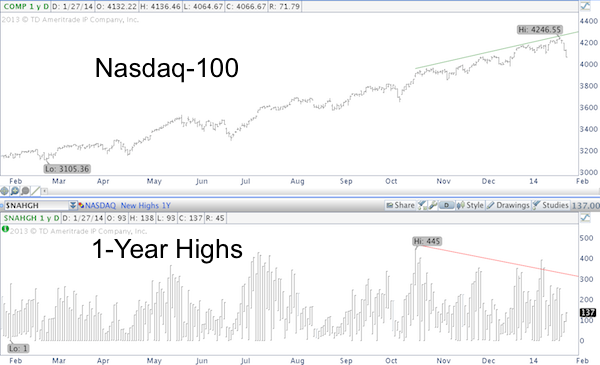
Divergences: The Nasdaq-100 (Nasdaq: QQQ) has been the strongest of all indexes, but even the Nasdaq-100 has shown breadth divergences.
The Nasdaq chart below shows that the number of new 52-highs for individual component stocks could not keep up with the new index highs. This shows that fewer and fewer companies carried the weight.
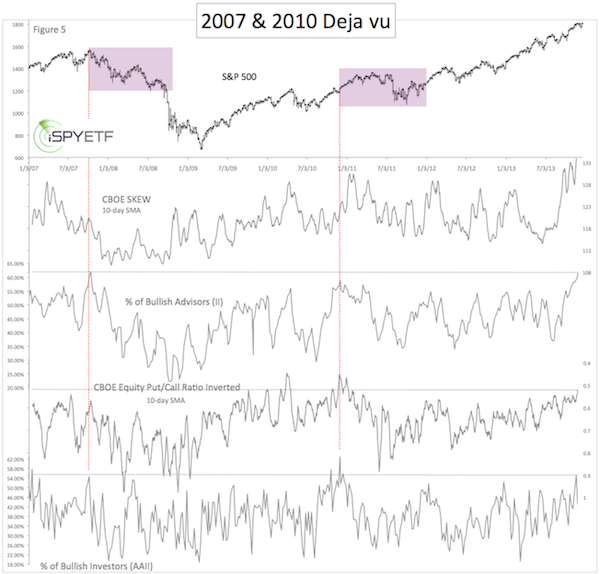
Bullish Sentiment: The Profit Radar Report’s full 2014 Forecast featured the chart below and warned that: “Investors are roughly as bullish about stocks now as they were in late 2007 and late 2010. Based on the above data, investors are fully invested. A fully invested person can only do one of two things: hold or sell. Neither action buoys prices.”
The Profit Radar Report’s 2014 Forecast is based on technical analysis (which includes divergences, Elliott Wave Theory, and support/resistance levels), seasonalities and cycles (which includes various seasonality charts for the S&P 500 and two long-term cycles that suggest a looming long-term top) and sentiment.
All the indicators combined suggested a correction right around 1,855 (a Fibonacci projection level going back to the 2002 lows).
Conclusion
Last weeks sell off saw a change in character for the stock market (see below for more info). This change of character is a first step towards lower prices.
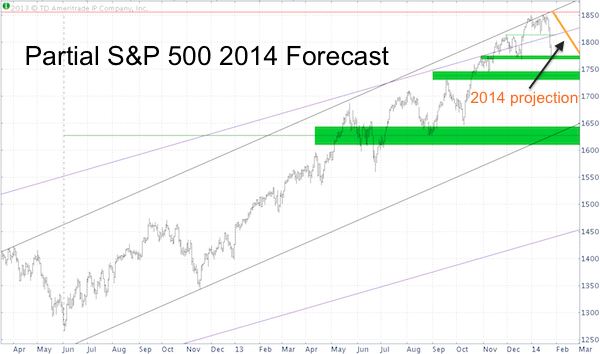
So far the S&P 500 (SNP: ^GSPC) is following the forecast outlined by the Profit Radar Report’s 2014 Forecast (see chart above with yellow projection).
Our indicators suggest a bounce and more pain ahead. The 2014 Forecast with the full year projection (yellow line) is available via the Profit Radar Report.
Simon Maierhofer is the publisher of the Profit Radar Report. The Profit Radar Report presents complex market analysis (stocks, gold, silver, euro and bonds) in an easy format. Technical analysis, sentiment indicators, seasonal patterns and common sense are all wrapped up into two or more easy-to-read weekly updates. All Profit Radar Report recommendations resulted in a 59.51% net gain in 2013.
Follow Simon on Twitter @ iSPYETF or sign up for the FREE iSPYETF Newsletter to get actionable ETF trade ideas delivered for free.

|
