Wall Street is starting to read the tea leaves as financial outlets brew their 2014 forecasts.
As we know from past ‘brews,’ it’s tough to come up with an elixir that actually ends up being spot on.
Here's something better than tea leaves:
The months of December and January are rich with barometers for the year ahead.
There’s the Santa Claus Rally (SCR), First 5 Days of January (F5J), and the January Barometer (JB).
The table below shows the performance of each indicator/barometer (based on S&P 500) since 1970 along with the full year performance of the S&P 500 (SNP: ^GSPC).
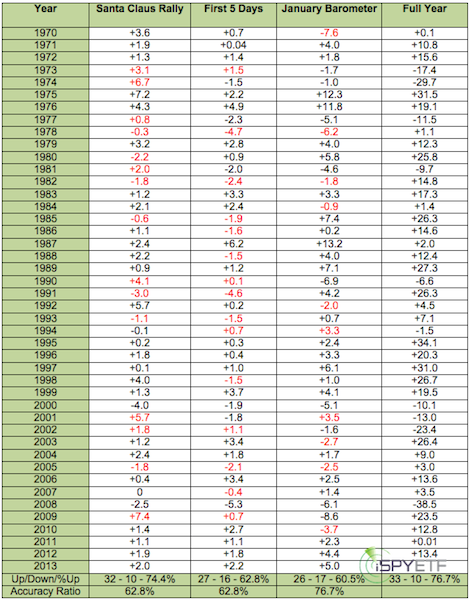
On a stand-alone basis, the January Barometer (as January goes so goes the year) is the most accurate of the three barometers with an accuracy ratio of 76.7%. Click here to read about the one Santa Claus Rally tall tale that fools all of Wall Street.
2012/13 saw a positive SCR, F5J, and JB. Since 1950 that’s only happened 16 times.
When that’s the case, the Profit Radar Report forecast for 2013 stated that: “The S&P 500 finished with full-year gains each of the 16 times.”
Baring a 25% drop before the end of the year, this three-prong indicator will lock in a 17 for 17 record, maintaining its 100% accuracy ratio.
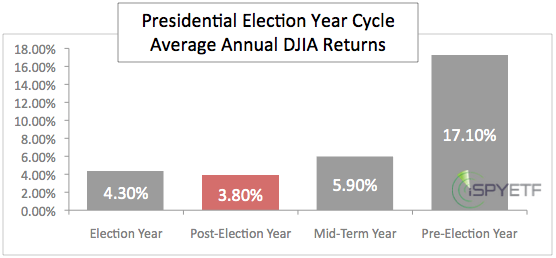
Post-election years (such as 2013) are the weakest of the 4-year presidential election year cycle. The average gain of a post-election year is only 3.8% for the S&P 500 (see chart below).
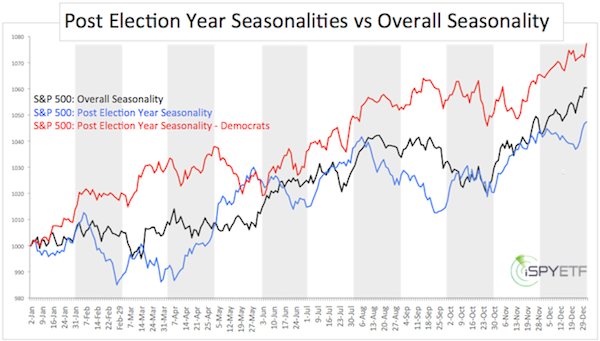
However, the January 15, 2013 Profit Radar Report update pointed out that: “Post-election year performance under democratic presidents is much more bullish than post-election and overall seasonality."
The seasonality chart below (featured in the January 15 Profit Radar Report update) shows the difference between post-election year seasonality with democratic presidents and ‘regular’ annual seasonalities.
We use the S&P 500 for our calculations, because it includes 500 stocks instead of the 30 stocks covered by the Dow Jones (DJI: ^DJI). An analysis based on the Dow Jones will yield very similar results.
The Profit Radar Report’s 2014 forecast is made up of various different components, which include technicals, sentiment, seasonal patterns, cycles, and fundamental trends.
What will 2014 bring for the S&P 500 (NYSEArca: SPY) and Dow Jones (NYSEArca: DIA)?
We are waiting for the 2014 barometer results and will include them in our 2014 forecast formula as soon as they become available.
In the meanwhile you may access a short-term forecast here:
Will Stocks Suffer a 'Pop and Drop' or Rally into the Next Year?
Simon Maierhofer is the publisher of the Profit Radar Report. The Profit Radar Report presents complex market analysis (stocks, gold, silver, euro and bonds) in an easy format. Technical analysis, sentiment indicators, seasonal patterns and common sense are all wrapped up into two or more easy-to-read weekly updates. We are accountable for our work, because we track every recommendation (see track record below).
Follow Simon on Twitter @ iSPYETF or sign up for the FREE iSPYETF Newsletter to get actionable ETF trade ideas delivered for free.

|
