The VIX just closed at 10.73, the lowest level since February 2007. How much lower can it go? That's a good question, but perhaps not the right question to ask.
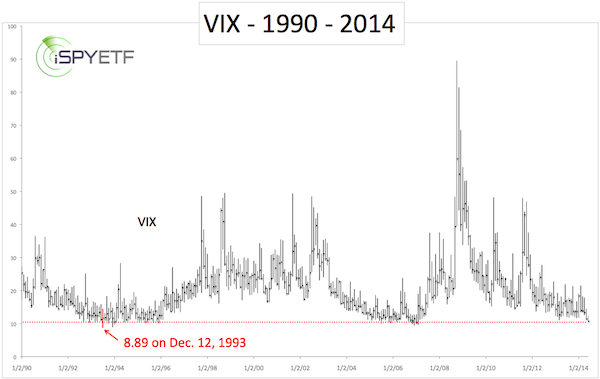
This little factoid is probably more useful for financial geek trivia than an actual target, but the VIX all-time low was at 8.89 on December 27, 1993 (see VIX chart below).
$13 Million Record Bet Gone Bad
On May 23, I wrote a commentary about a trader who placed a bullish $13 million VIX bet (click here for my original VIX commentary). In my humble opinion that was an ill-timed gamble for a number of reasons:
-
On May 18 the VIX slipped below a support cluster at 12. The May 18 Profit Radar Report (where I share most of my research) proposed that: “A move below 12 would suggest further up side for the S&P 500 (NYSEArca: SPY) and down side for the VIX.”
-
VIX seasonality pointed still lower. The May 21 Profit Radar Report featured a VIX seasonality chart and stated that: “VIX seasonality is not yet supportive of higher readings” (details on how to obtain a free VIX seasonality chart shown below).
-
The same Profit Radar Report warned of the ‘contango trap.’ Contango persistently erodes bullish VIX bets about 80% of the time. The actual creator of the VIX just warned of this contango trap today (CNBC: “A Warning from the ‘Father of the VIX”).
Most VIX related ETFs and ETNs that profit from higher prices - like the iPath S&P 500 VIX Short-term Futures ETN (NYSEArca: VXX) and VelocityShares Daily 2x VIX Short-term ETN (NYSEArca: TVIX) - suffer from contango-caused profit erosion.
VIX ETFs and ETNs like the VelocityShares Daily Inverse VIX Short-term ETN (NYSEArca: XIV) benefit from contango (of course the time to buy XIV is when the VIX is high, not low).
How Low Can the VIX Go?
The VIX is at a 7+ year low and obviously could jump at any given time. However, as long as trade remains below resistance at 12, it may also continue to drift lower or sideways.
In fact, I think that sideways trading, lack of a real up side punch and contango may be a bigger problem for bullish bets than continued down side (it takes a 10%+ move to neutralize contango and make decent money on bullish VIX trades).
Perhaps the strongest argument for a rising VIX comes from the S&P 500. Two normally reliable sentiment indicators just reached multi-year bullish (bearish for stocks) extremes.
Here is a closer look at those two sentiment gauges and what the extreme readings mean for the S&P 500 and VIX (the article also includes a link to the only free and updated VIX seasonality chart available online).
Two Sentiment Gauges Reach Multi-Year Bullish Extremes
Simon Maierhofer is the publisher of the Profit Radar Report. The Profit Radar Report presents complex market analysis (S&P 500, Dow Jones, gold, silver, euro and bonds) in an easy format. Technical analysis, sentiment indicators, seasonal patterns and common sense are all wrapped up into two or more easy-to-read weekly updates. All Profit Radar Report recommendations resulted in a 59.51% net gain in 2013.
Follow Simon on Twitter @ iSPYETF or sign up for the FREE iSPYETF Newsletter to get actionable ETF trade ideas delivered for free.

|
