|
|
| VIX Seasonality Sports Brief Bearish Window |
| By, Simon Maierhofer
|
| Monday August 11, 2014 |
|
|
|
|
| The CBOE Volatility Index, or VIX, has been following its general seasonal pattern rather closely, especially since the seasonal VIX low in July. Within a larger seasonally bullish period, there is a brief bearish window that may draw the VIX lower. |
|
VIX seasonality has been an indicator worth watching.
The VIX seasonality chart projected a major seasonal low on July 9.
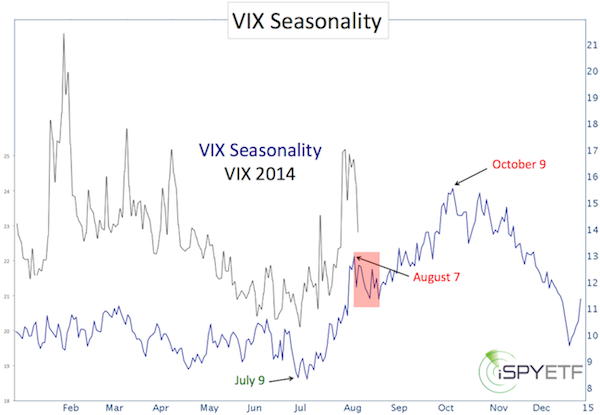
On July 10, the VIX spiked as much as 9.8% and on July 17, the VIX soared as much as 41.7%.
From the July 2 low at 10.28 to the August 1 high of 17.57 the VIX gained 71%.
Despite bullish VIX seasonality, the early August spike seemed overdone. The August 1 Profit Radar Report stated that:
“The VIX spiked 27% today, a kneejerk reaction similar to that of July 17. We would actually like to see another VIX spike sometime in August, and if we do we will likely buy the VelocityShares Inverse VIX ETN (NYSEArca: XIV). XIV benefits from a declining VIX.”
Here are some interesting behavioral VIX nuances:
-
Although the S&P 500 (NYSEArca: SPY) saw another low on August 7, the VIX high of August 1 remain intact.
-
Although the August 1 VIX high remained in tact, XIV dropped to another low on August 7 (the August 6 Profit Radar Report recommended to buy XIV at 35.10).
The chart below plots the VIX against XIV. Sideways trading following the August 1 VIX high resulted in lower XIV prices.
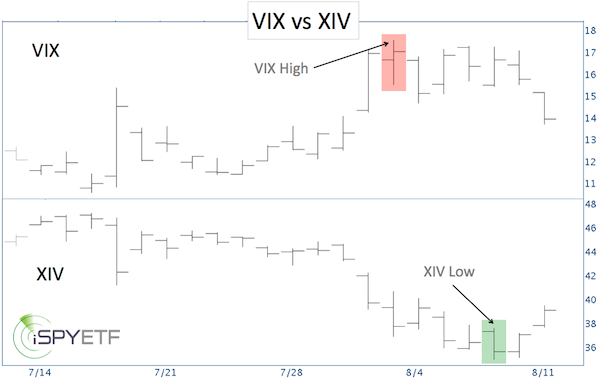
This deviation is caused by contango. Contango generally favors bearish VIX bets. Click here for a detailed explanation of contango.
Summary:
-
The VIX seasonality chart allows the following conclusions:
-
July 9 – October 9 are bullish for the VIX.
-
Within this bullish 3-month zone, there is a brief window of bearish seasonality from August 7 – August 22.
-
Any VIX rally into early October should provide a good opportunity to short the VIX.
Simon Maierhofer is the publisher of the Profit Radar Report. The Profit Radar Report presents complex market analysis (S&P 500, Dow Jones, gold, silver, euro and bonds) in an easy format. Technical analysis, sentiment indicators, seasonal patterns and common sense are all wrapped up into two or more easy-to-read weekly updates. All Profit Radar Report recommendations resulted in a 59.51% net gain in 2013.
Follow Simon on Twitter @ iSPYETF or sign up for the FREE iSPYETF Newsletter to get actionable ETF trade ideas delivered for free.

|
|
|
|
|
|
|
|
|
|
|
|
|
|
