Bearish divergences are often just that for the market – bearish.
Right now there is a bearish divergence between RSI and the S&P 500, but is this divergence enough to mark a major market top?
To find out we will take a look at the recent track record of RSI and the track record of two very reliable divergence indicators.
RSI in Technical 'Purgatory'
The S&P 500 chart below shows that RSI (I use a 35-period RSI) has not confirmed the S&P 500’s latest all-time high. In fact, considering the strength of the rally, the RSI lag is quite blatant.
RSI used to be a valuable and often used tool in my technical analysis toolkit. I used bearish RSI divergences to warn of the 2010 and 2011 corrections and bullish RSI divergences to pinpoint the October 2011 and June 2012 lows.
However, in 2013 RSI hasn’t been of much use. The S&P 500 (SNP: ^GSPC) chart below shows that not a single S&P 500 high (green lines) or low (red lines) was accompanied by a RSI divergence.
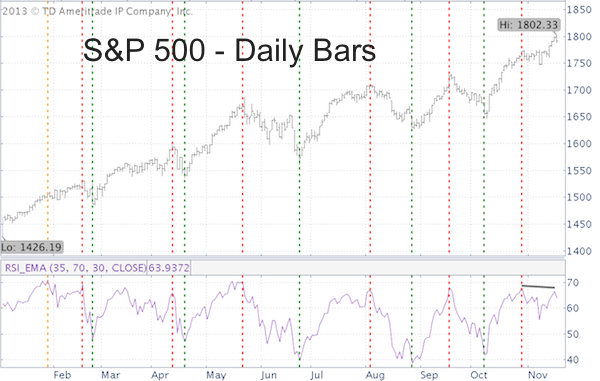
The RSI high for the year occurred on January 29 (yellow line), but January 29 didn’t mark any meaningful high and neither did any of the subsequent high watermarks in April, May, August, September or October.
What about the November High?
This year’s track record doesn’t exactly inspire confidence in the predictive qualities of RSI. Along with the VIX (NYSEArca: VXX), which hasn’t worked as a contrarian indicator in well over a year, RSI is in technical ‘purgatory.’
The 'Reliable Duo'
A more reliable breadth and breadth divergence gauge is the NY Composite Advance/Decline (A/D) line.
This week’s new S&P 500 (NYSEArca: SPY) and Dow Jones (DJI: ^DJI) all-time highs were not confirmed by the NY Composite A/D line – a bearish divergence.
A similar bearish divergence accompanied the August high, which led to a temporary decline.
Here is the wrinkle though.
The NY Composite encompasses all the issues traded on the New York Stock Exchange (NYSE). A little over half of the NYSE traded issues are categorized as non-operating companies, which includes closed-end bond funds, preferred stocks, foreign stocks and ADRs.
Most of those non-operating companies are interest-rate sensitive closed end-bond funds and preferred stocks.
Rising interest rates, such as we’ve seen lately, artificially depresses the NY Composite A/D line, which explains the current bearish divergence.
To get a more genuine A/D line one must strip the NY Composite A/D line of all non-operating companies.
The ex-non-operating NY Composite A/D line did confirm the May, August and September highs and continually pointed towards new highs.
The ex-non-operating NY Composite A/D line nearly confirmed Monday’s S&P 500 (NYSEArca: SPY) and Dow Jones all-time highs.
In summary, a closer look at historically reliable breadth measures suggests that stocks are in for a temporary correction (depth yet to be determined) followed by another rally leg. Continuous updates on the NY Composite A/D and ex-non-operation A/D line is provided via the Profit Radar Report.
Ironically the message of one of the most solid gauges in the business is confirmed by one of the most curious and non-scientific 'indicators' around. But don't be fooled, although non-scientific, this indicator worked well earlier in 2013 and should not be ignored.
Click here for a fun, but worthwhile thumbnail analysis of this curious indicator and it's meaning for the S&P 500.
Can a Watched Bubble Burst?
Simon Maierhofer is the publisher of the Profit Radar Report. The Profit Radar Report uses technical analysis, dozens of investor sentiment gauges, seasonal patterns and a healthy portion of common sense to spot low-risk, high probability trades (see track record below).
Follow Simon on Twitter @ iSPYETF or sign up for the iSPYETF Newsletter to get actionable ETF trade ideas delivered for free.

|
