I always follow multiple indicators, especially when we’ve got ‘skin in the game.’
As per the August 28 Profit Radar Report, we went long the S&P 500 at 1,642.
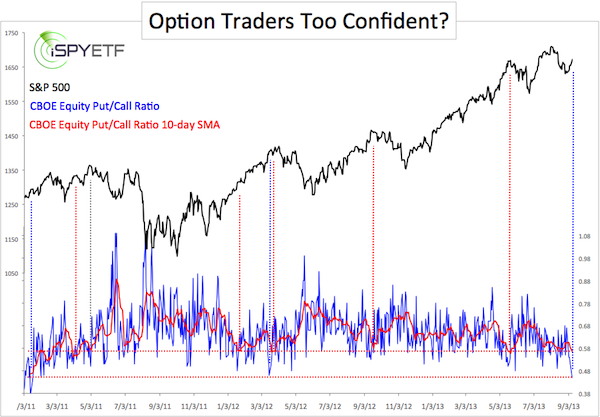
Our up side target was an open chart gap at S&P 1,685. Open gaps pull price like a magnet. The S&P 500 is within striking distance of the open gap, and according to option traders risk is rising.
On Tuesday the CBOE Equity Put/Call Ratio dropped to 0.45, the lowest reading since early 2011 (blue line). This means that option traders are buying more than two calls for every put, a bullish extreme.
The 10-day SMA for the put/call ratio is at 0.566, the lowest since the May 2012 high.
What does such a low equity put/call ratio mean?
Back in April 2010 the put/call ratio fell as low as 0.32 and I sent out the following warning and explanation to subscribers on record:
“The put/call ratio can have far reaching consequences. Protective put-buying provides a safety net for investors. If prices fall, the value of put options increases balancing any losses incurred by the portfolio. Put-protected positions do not have to be sold to curb losses. At current levels however, it seems that only a minority of equity positions are equipped with a put safety net. Once prices do fall and investors get afraid of incurring losses, the only option is to sell. Selling results in more selling. This negative feedback loop usually results in rapidly falling prices.”
Just a couple of weeks later the S&P 500 (SNP: ^GSPC), Nasdaq (Nasdaq: ^GSPC), and Dow Jones (DJI: ^DJI) spiraled lower in what was later dubbed the ‘Flash Crash.’
Obviously, the current reading is not as bad as in April 2010, but as the chart below shows it is at a level that’s led to lower prices all but once (with or without delay) since 2011. The one exception occurred in January 2012.
What to Do?
The Nasdaq (Nasdaq: QQQ) has rallied to new highs. This seems bullish, but seasonality for AAPL is soon turning bearish. The S&P’s up side target for the rally from the August 28 low – 1,627 for the S&P 500, 163 for SPY (NYSEArca: SPY) – is just a few points away. In short, risk is rising.
This doesn't mean that prices can't move any higher, but it's prudent to lock in gains or raise stop-loss levels.
A stunning long-term outlook that puts the current rally into context is available to subscribers of the Profit Radar Report.
Simon Maierhofer is the publisher of the Profit Radar Report.
Follow Simon on Twitter at iSPYETF or sign up for the FREE Newsletter.
|
