Last week’s trading range (from February 11 – 15) was a whopping 11 points for the S&P 500. A candle chart visually expresses this performance with 5 candles called dojis.
What exactly is a doji and what does it mean for the market?
A doji candle is formed when the open and close are the same or very close to equal. The body (see “Anatomy of a Candle” chart) is narrow.
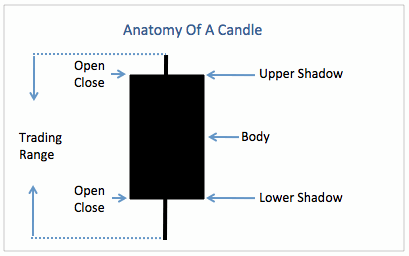
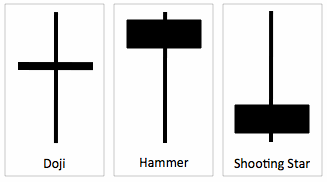
The upper and lower shadows vary depending on the type of doji (see second chart). All doji candles reflect a measure of equality between buyers and sellers and a period of indecision.
The Monday (February 18) Profit Radar Report included the following analysis (including chart) of dojis and periods of sideways trading:
“The market usually doesn’t give investors a whole lot of time to make the right decision (i.e. get out at the top), that’s why a cluster of dojis is rarely seen at significant highs.
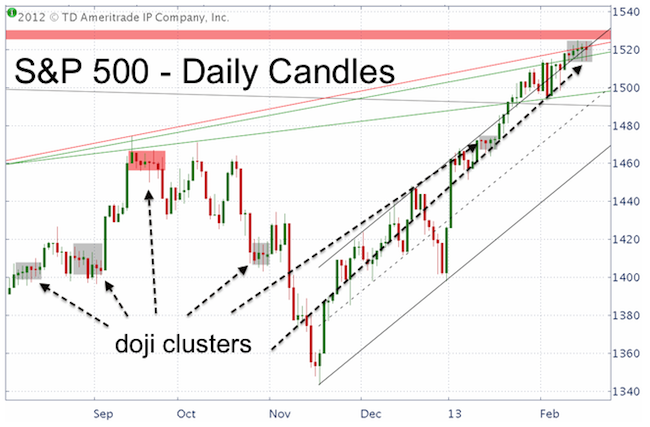
The candle chart below highlights various doji clusters. Most of them (gray boxes) were followed by spikes higher. The red box, although not a ‘doji top,’ is one possible exception. Dojis tend to relieve overbought (or oversold) conditions and tend to provide more fuel for the next move.
Based on the market’s MO, a move above last week’s high (S&P 1,524.69), would likely result in another 10+ point rally.”
The Profit Radar Report is putting the dojis in short-term context with nearby support/resistance levels and in long-term context with an extensive 2013 market forecast.
|
