Almost haft of all airplane accidents occur during takeoff or landing?
That’s when the speed is slower, more airplanes are in the immediate airspace, and most importantly, that’s when the plane is in close proximity to the ground.
Similarly, most stock reversals occur at support/resistance levels.
Why? There’s more action, or friction at support/resistance levels.
A little while ago we asked “Is it Too Late to Jump into Stocks? Watch S&P Reaction to This Inflection Point.” Key resistance for the S&P 500 at the time was just below 1,900.
The S&P has been stuck in a rut, because it wasn’t able to overcome this hurdle, in fact, it was rebuffed by this inflection point several times (click above link to view S&P 500 resistance, still valid today).
Here’s a clear resistance level for the Dow Jones (DJI: ^DJI).
Shown is a log scale of the Dow Jones (NYSEArca: DIA) going back to 1999. The resistance level is constructed by connecting the 2000 and 2007 highs.
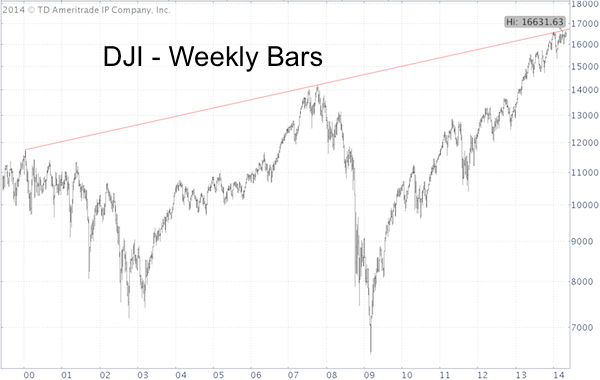
We don’t create those ‘lines in the sand,’ the market does. We just connect the dots.
The Dow seems to think this line is important, so should we.
The simple conclusion is that trade below the trend line limits up side potential, while trade above the trend line would unlock higher targets.
There’s only one reason to expect a false trend line throw-over top. More details here:
Expecting ‘Sell in May and Go Away’ Pattern? – Prepare for Surprise
Simon Maierhofer is the publisher of the Profit Radar Report. The Profit Radar Report presents complex market analysis (S&P 500, Dow Jones, gold, silver, euro and bonds) in an easy format. Technical analysis, sentiment indicators, seasonal patterns and common sense are all wrapped up into two or more easy-to-read weekly updates. All Profit Radar Report recommendations resulted in a 59.51% net gain in 2013.
Follow Simon on Twitter @ iSPYETF or sign up for the FREE iSPYETF Newsletter to get actionable ETF trade ideas delivered for free.

|
