Are stocks overvalued? That’s a good question, but a better question is whether stocks are priced for long-term gains?
An individual stock - or the entire stock market - can be overvalued and still increase in value. A drunk driver may still be able to operate a vehicle, but the odds of a drunk driver or overvalued market to crash is much higher.
Buying an undervalued stock (or staying out of an overvalued market) on the other hand, places the odds in favor of the investor.
When dealing with probabilities – which is what investing is all about – having the odds in your favor is the best you can do.
Having that in mind, we ask again: Are stocks set to delivery long-term gain or pain?
Before we get to the valuation analysis, keep in mind that valuations are a long-term guide. We don’t use long-term indicators for short-term trades. A number of shorter-term indicators point to still higher prices ahead.
Pain or Gain?
Today we’ll look at valuations based on P/E ratios.
The current P/E ratio (based on Robert Shiller’s cyclically adjusted P/E ratio) is 21. The average P/E ratio going back to the year 1900 is 16.9. In other words, the P/E ratio is 26.9% above its historic average.
A reversion to the mean would imply a 26.9% drop in stock prices or a dramatic increase in earnings.
Is there a correlation between P/E ratios and the S&P 500? The chart below plots P/E ratios against the S&P 500. The vertical red and green lines highlight the correlation between P/E ratios and market tops/bottoms for the S&P 500.
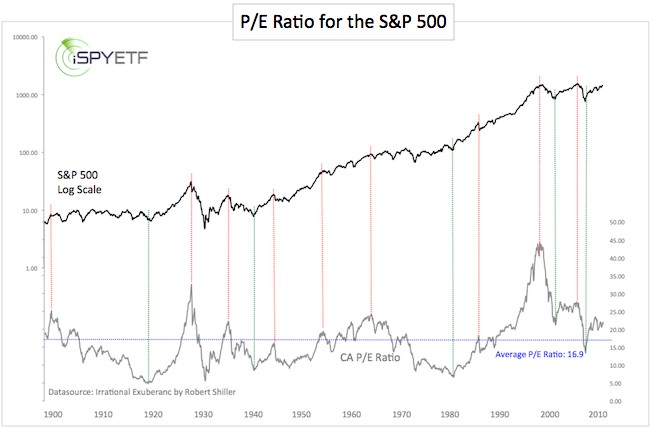
Current P/E ratios are not at extremes that have historically marked major tops or bottoms, but P/E ratios do at best suggest sluggish growth going forward.
The visually illustrated study below shows the correlation between P/E ratios and their respective forward return. The study covered the period from 1871 - 2010 and is based on the S&P 500 (S&P predecessors prior to 1957). P/E ratios are based on rolling average ten-year earnings/yields.
P/E ratios and the corresponding ten-year forward returns, were grouped into five quintiles in 20% intervals. As the chart shows, the cheapest quintile had the highest ten-year forward return while the most expensive quintile had the lowest return.
The projected 10-year forward real return for the S&P 500 with a P/E ratio of 21 stocks is around 4.5%.
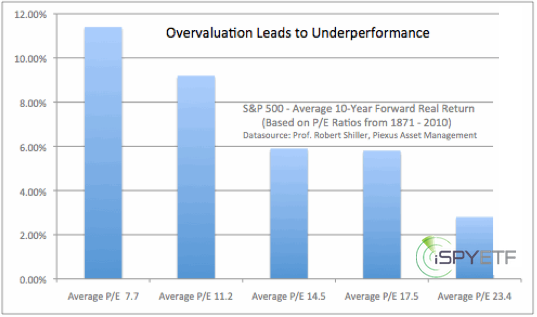
Keep in mind that the 1871 – 2010 span hosted multi-decade bull markets where P/E ratios remained in overvalued territory for extended periods of time. During a bear market, the forward return is likely to be much lower than the study suggests.
There are other factors that influence earnings, P/E ratios, and ultimately stocks’ performance. Those factors will be the subject of an upcoming article.
|
