Based on the Commitment of Traders Report (COT) and gold assets held in gold ETFs like the SPDR Gold Shares (NYSEArca: GLD) and iShares Gold Trust (NYSEArca: IAU), we know that investors/traders do not want to own gold right now.
In fact, both sentiment gauges have plunged to 5-year lows. Sentiment surrounding the precious yellow metal is bearish enough to spark a rally.
The big question is whether any rally will be fake and short or real and long.
At major market bottoms investors generally throw in the towel. Some call this the ‘puke point,’ where all the weak hands are purged out.
We’ve seen such a 'puke point' for the S&P 500 in March 2009 and once again in October 2011 (the Profit Radar Report identified both of them).
The opposite of the 'puke point' is the extreme infatuation seen around gold’s nominal all-time high in September 2011. Everyone wanted to own it. When everyone is scrambling to buy an asset from you, it’s best to give it to them.
Via the August 24, 2011 Profit Radar Report I warned subscribers that: “I don’t know how much higher gold will spike, but I’m pretty sure it will melt down faster than it's melting up. We should see sellers en masse.”
Unlike the S&P 500 (SNP: ^GSPC), gold has been in a bull market for most of the 21st century. This means that data mining for past market bottoms is difficult, especially when looking at gold ETFs with price history limited to eight years.
Nevertheless, the chart below should be helpful in spotting a lasting gold bottom.
The chart plots the price of gold against gold (in tons) held by GLD and IAU.
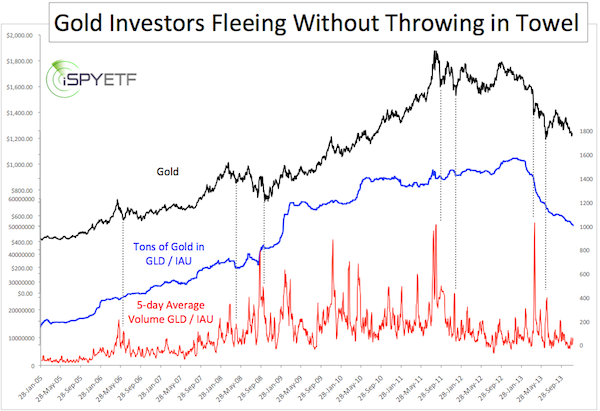
The red graph at the bottom shows the 5-day average combined trading volume for GLD/IAU.
Gold assets have been in freefall mode. This shows us that gold may be oversold, but that’s about it.
The volume data is much more insightful. There’s been a volume spike at every prior gold low – the puke point. But there hasn’t been a volume spike recently.
The absence of obvious mass surrender suggests that a lasting gold bottom has yet to be seen. My most recent Profit Radar Report includes ideal targets for this major gold low along with short-term key resistance.
Simon Maierhofer is the publisher of the Profit Radar Report. The Profit Radar Report presents complex market analysis (stocks, gold, silver, euro and bonds) in an easy format. Technical analysis, sentiment indicators, seasonal patterns and common sense are all wrapped up into two or more easy-to-read weekly updates. We are accountable for our work, because we track every recommendation (see track record below).
Follow Simon on Twitter @ iSPYETF or sign up for the FREE iSPYETF Newsletter to get actionable ETF trade ideas delivered for free.

|
