I am in a predicament. I want you to know about the one indicator that will be more useful in the year ahead than any other stock market related indicator (you’ll see why this indicator is essential for any investor in a moment).
But (and that’s a big but), I want to be fair to my subscribers. Since it wouldn’t be right to share research reserved for paying subscribers, I came up with this solution:
You will see the indicator in its full power and glory, but I won’t disclose the name of the indicator. It will simply be dubbed ‘secret sauce.’
I’ve been following secret sauce for many years. What makes this indicator unique is that it has protected those ‘listening’ from many bear markets, while keeping investors on the right side of the trade (long and strong) throughout this bull market.
Never Miss a Beat! >> Sign up for the FREE iSPYETF e-Newsletter
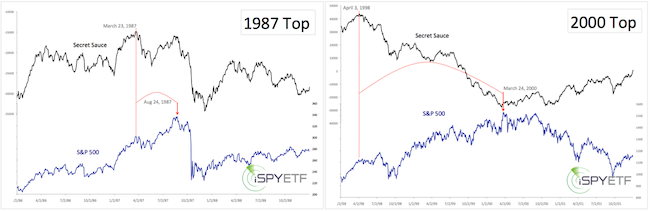
Although I wasn’t aware of it when I first learned about secret sauce, my research shows that secret sauce correctly telegraphed the 1987, 2000 and 2007 market tops.
How it Works
Secret sauce reveals a terminal condition often hidden by price action: Internal stock market deterioration (for a detailed description go here).
The charts below show how the market lost steam internally (black line) even though the S&P 500 (blue line) continued higher … right until it hit the ceiling in 1987 and 2000.
The same thing happened prior to the 2007 top. Secret sauce stopped confirming the S&P 500 highs on June 4 (dashed red line). The market topped on October 11 and rolled over.
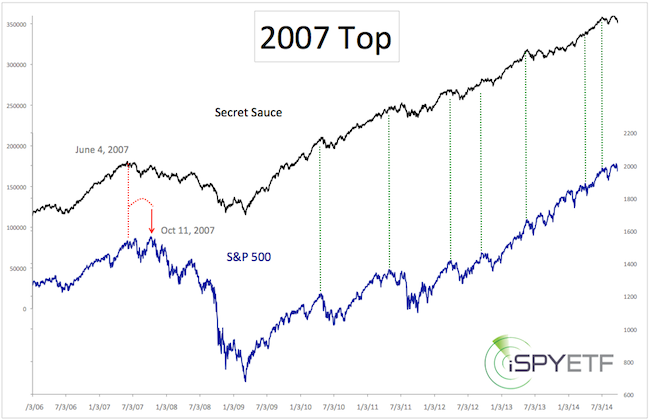
The dashed green lines in the above chart show that secret sauce confirmed every new S&P 500 high since the bull market took off in 2009, telegraphing that every correction was eventually to be succeeded by new highs.
Obviously, secret sauce isn’t necessarily a short-term indicator, but the advance notice of the market’s intention is invaluable to almost every type of investor.
Knowing whether short-term draw downs will eventually be recovered is incredible insight not offered by any other indicator.
Secret sauce is the main reason why the Profit Radar Report has continually looked for new highs, even in April/May 2014 when the media strongly advertised a market crash.
At some point secret sauce will not confirm new S&P 500 highs and send a warning signal. In fact, there is a fledgling bearish non-confirmation right now. Seasonality and sentiment suggest that this small divergence is meaningless.
The Profit Radar Report continuously monitors and updates secret sauce. Check out what Investor's Business Daily and others have to say about the Profit Radar Report.
Simon Maierhofer is the publisher of the Profit Radar Report. The Profit Radar Report presents complex market analysis (S&P 500, Dow Jones, gold, silver, euro and bonds) in an easy format. Technical analysis, sentiment indicators, seasonal patterns and common sense are all wrapped up into two or more easy-to-read weekly updates. All Profit Radar Report recommendations resulted in a 59.51% net gain in 2013.
Follow Simon on Twitter @ iSPYETF or sign up for the FREE iSPYETF Newsletter to get actionable ETF trade ideas delivered for free.

|
